 PCB
PCB FPC
FPC Rigid-Flex
 FR-4
FR-4 HDI PCB
 Rogers High-Frequency Board
 PTFE Teflon High-Frequency Board
 Aluminum
 Copper Core
 PCB Assembly
 LED light PCBA
 Memory PCBA
 Power Supply PCBA
 New Energey PCBA
 Communication PCBA
 Industrial Control PCBA
 Medical Equipment PCBA
 Testing Service
 PCBA Testing Service
 Certification Application
 RoHS Certification Application
 REACH Certification Application
 CE Certification Application
 FCC Certification Application
 CQC Certification Application
 UL Certification Application
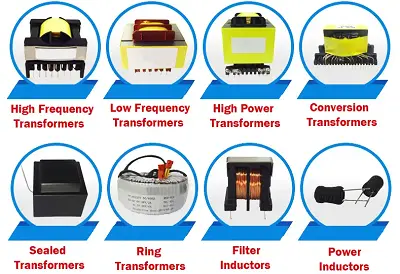 Transformers, Inductors
 High Frequency Transformers
 Low Frequency Transformers
 High Power Transformers
 Conversion Transformers
 Sealed Transformers
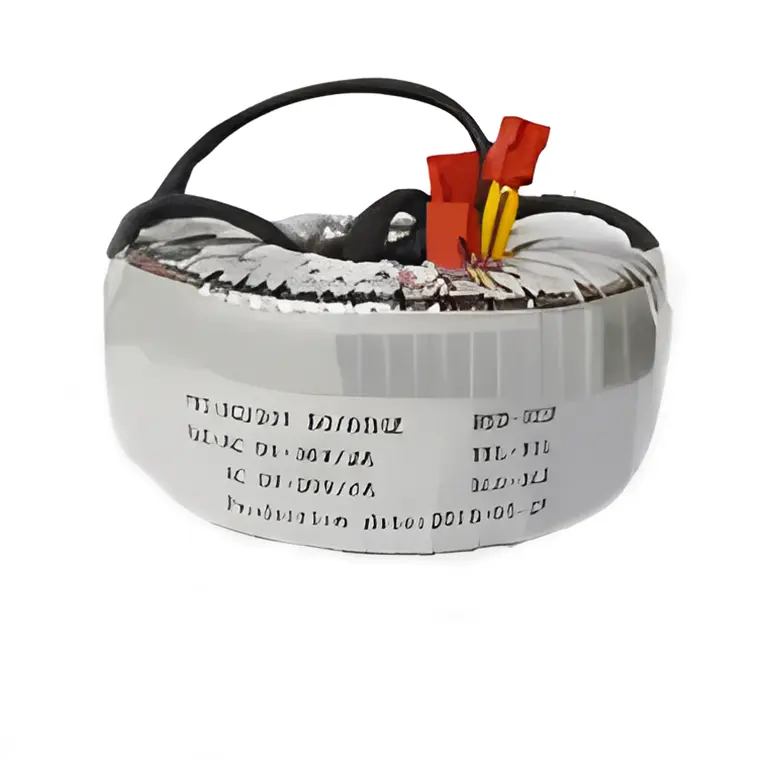 Ring Transformers
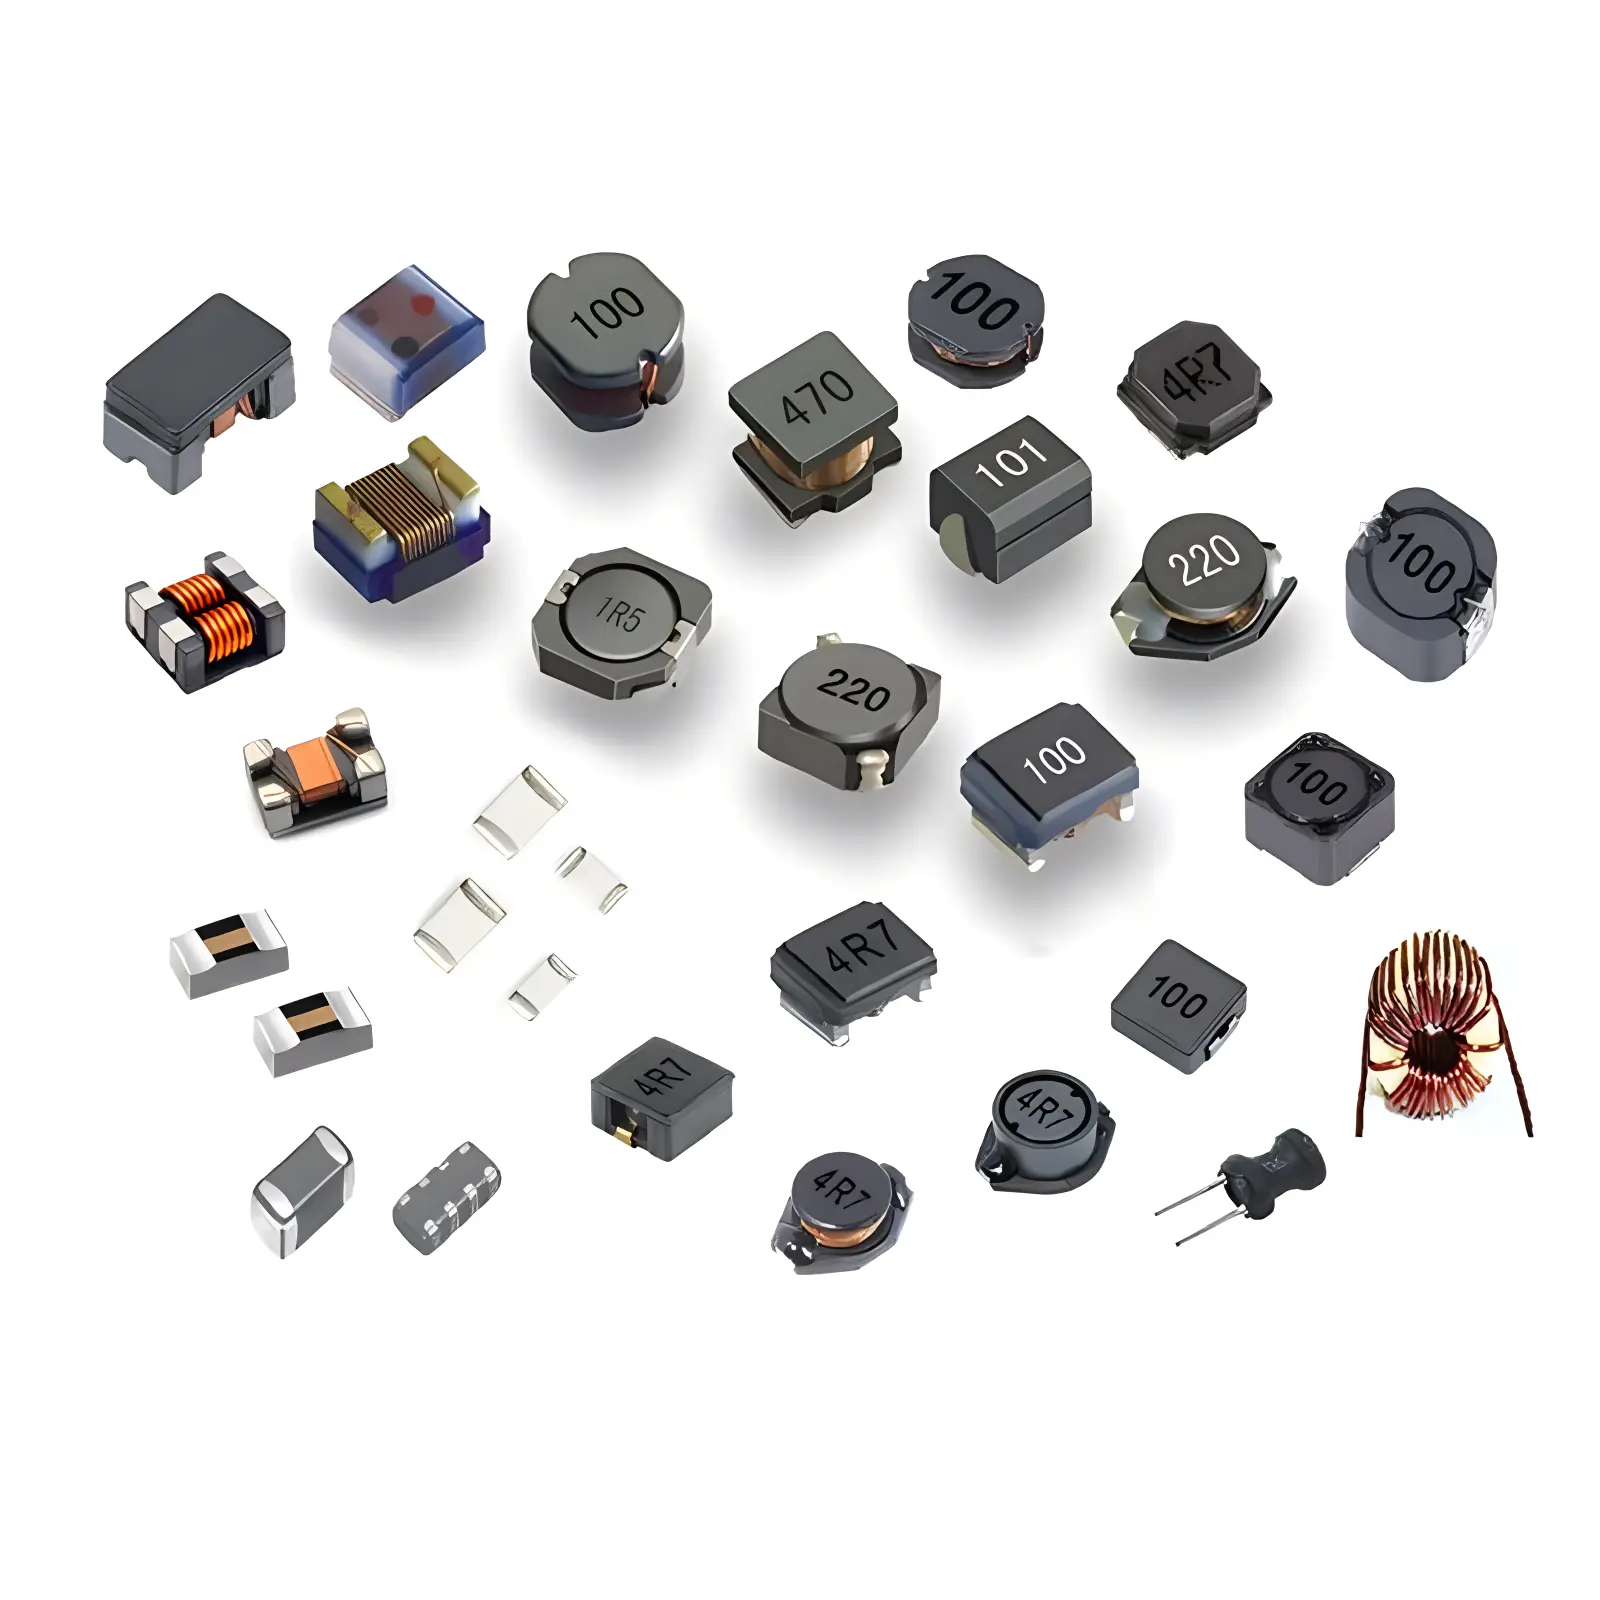 Inductors
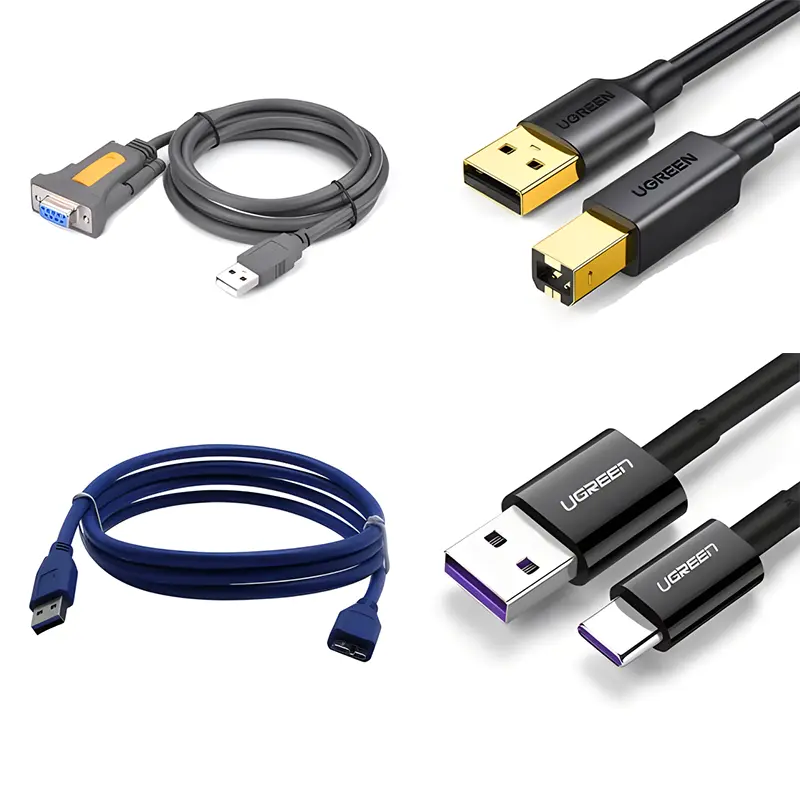 Wires,Cables Customized
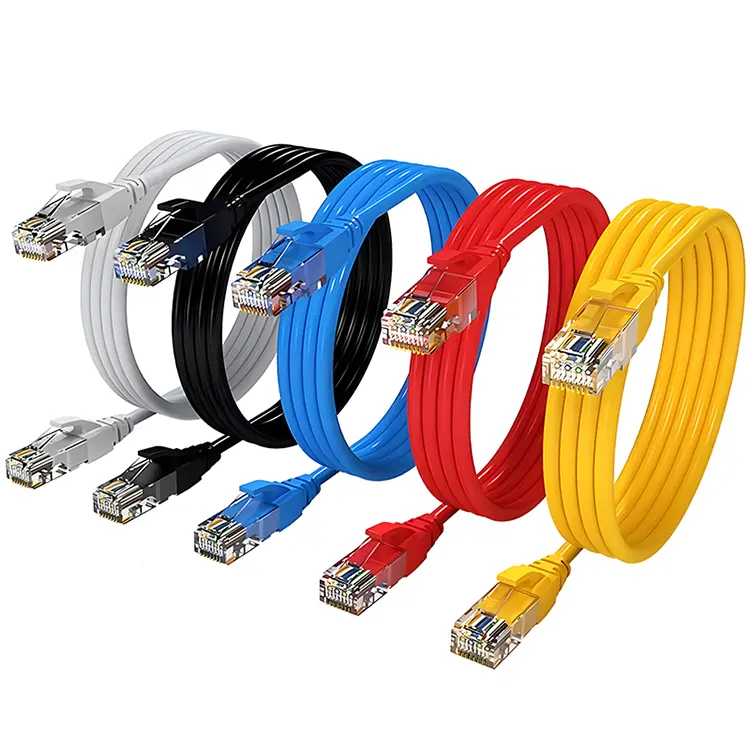 Network Cables
 Power Cords
 Antenna Cables
 Coaxial Cables
 Net Position Indicator
 Solar AIS net position indicator
 Capacitors
 Connectors
 Diodes
 Embedded Processors & Controllers
 Digital Signal Processors (DSP/DSC)
 Microcontrollers (MCU/MPU/SOC)
 Programmable Logic Device(CPLD/FPGA)
 Communication Modules/IoT
 Resistors
 Through Hole Resistors
 Resistor Networks, Arrays
 Potentiometers,Variable Resistors
 Aluminum Case,Porcelain Tube Resistance
 Current Sense Resistors,Shunt Resistors
 Switches
 Transistors
 Power Modules
 Isolated Power Modules
 AC-DC Power Modules
 DC-AC Module(Inverter)
 RF and Wireless
Monitoring Temperature Zone Stability of Reflow Oven via Online SPC
2025-09-23
The Relationship Between Reflow Oven Temperature Zone Stability and Online SPC
Reflow oven is the core equipment in SMT production, and the temperature stability of its temperature zones directly determines the solder joint quality. Excessive temperature fluctuation in the temperature zone (such as exceeding ±3℃) will lead to insuffICient solder melting, abnormal flux volatilization, solder joint cold solder/bridging and other defects, which will affect product reliability in severe cases. According to industry statistics, about 40% of SMT soldering defects are related to the unstable temperature zone of the reflow oven.
Online Statistical Process Control (SPC) monitors process fluctuations by real-time collecting temperature zone temperature data and using statistical analysis tools (such as control charts). It can identify abnormal trends of temperature zones in advance and avoid batch defects. Compared with the traditional "timed sampling inspection" mode, online SPC can realize "real-time, visual, and early warning" monitoring of temperature zone stability, which is a key technical means for reflow soldering process quality control.
2. Core Elements of Monitoring Reflow Oven Temperature Zone Stability via Online SPC
The online SPC monitoring system needs to be built around "data collection - statistical analysis - abnormal early warning - improvement closed-loop", and the core elements include:
- Monitoring Parameter Definition: Clarify the key parameters of the temperature zone to be monitored, such as the deviation between the set temperature and actual temperature of each temperature zone, the temperature uniformity inside the temperature zone, and the temperature transition gradient between temperature zones.
- Data Collection System: Realize real-time and high-precision collection of temperature data, and the sampling frequency and data accuracy must meet the analysis requirements.
- Statistical Analysis Model: Select appropriate SPC control charts (such as X-R chart, X-MR chart) to analyze the data and distinguish between "normal fluctuation" and "abnormal fluctuation".
- Early Warning and Processing Mechanism: Set reasonable control limits and early warning rules to ensure timely response and corrective measures when abnormalities occur.
3. Construction and Implementation Steps of Online SPC Monitoring System
3.1 Determine Monitoring Temperature Zones and Key Parameters
Reflow oven is usually divided into preheating zone (3-4 temperature zones), soaking zone (1-2 temperature zones), reflow zone (2-3 temperature zones), and cooling zone (1-2 temperature zones). Monitoring parameters should be set according to the functional characteristics of different temperature zones:
| Temperature Zone Type | Monitoring Parameters | Control Target |
|---|---|---|
| Preheating Zone/Soaking Zone | Deviation between actual temperature and set temperature (ΔT); temperature uniformity inside the temperature zone (T_max-T_min) | ΔT≤±2℃; uniformity≤±3℃ |
| Reflow Zone | Peak temperature deviation (ΔT_peak); temperature holding time fluctuation (Δt) | ΔT_peak≤±3℃; Δt≤±5 seconds |
| Cooling Zone | Cooling rate fluctuation (Δv); outlet temperature (T_out) | Δv≤±0.2℃/s; T_out≤50℃ |
3.2 Deployment of Data Collection System
Data collection is the foundation of online SPC, and it is necessary to ensure the real-time and accuracy of data:
- Sensor Selection and Installation: Install 2-3 high-precision thermocouple sensors (type K or T, accuracy ±0.5℃) in each temperature zone, which are arranged at the inlet, center, and outlet of the temperature zone respectively to monitor temperature uniformity;
- The sensor probe should be close to the PCB transmission path (5-10mm away from the transmission mesh belt) to avoid being affected by the furnace wall temperature; at the same time, high-temperature resistant wires (temperature resistance ≥300℃) are used to ensure long-term stable operation.
Data Acquisition Module Configuration: Select an industrial-grade data acquisition card (such as NI cDAQ-9178), set the sampling frequency to 1-2 times per second to ensure that the dynamic changes of the temperature zone temperature can be captured;
The data acquisition module communicates with the reflow oven PLC system to read the process parameters such as the set temperature and transmission speed of each temperature zone in real time, realizing the linkage collection of "temperature data + process parameters".
Data Storage and Transmission: Use an edge coMPUting gateway to transmit the collected data to the SPC monitoring platform in real time, and the data storage cycle is ≥3 months to facilitate historical traceability and trend analysis;
The transmission protocol selects MQTT or OPC UA to ensure the real-time (delay ≤1 second) and reliability of data transmission.
3.3 Selection and Application of SPC Control Charts
Select appropriate SPC control charts for analysis according to the type of monitoring parameters:
- X-R Control Chart (Mean-Range Chart): Suitable for monitoring the temperature deviation (ΔT) of each temperature zone — take the 3 sensor data of each temperature zone as a sample group (n=3), collect a group of data every 5 minutes, and calculate the sample mean (X) and range (R);
- Control limit calculation: X chart control limit UCL_X=X̄+A₂R̄, LCL_X=X̄-A₂R̄; R chart control limit UCL_R=D₄R̄, LCL_R=D₃R̄ (A₂, D₃, D₄ are control chart coefficients, when n=3, A₂=1.023, D₄=2.574, D₃=0);
- When X exceeds UCL_X or LCL_X, or R exceeds UCL_R, it is determined that the temperature fluctuation of the temperature zone is abnormal.
X-MR Control Chart (Individual-Moving Range Chart): Suitable for monitoring "single-value type" parameters such as reflow zone peak temperature and cooling zone cooling rate — collect a single data point each time, and calculate the moving range (MR) with the previous data point;
Control limit calculation: X chart control limit UCL_X=X̄+2.66MR̄, LCL_X=X̄-2.66MR̄; MR chart control limit UCL_MR=3.267MR̄, LCL_MR=0;
When 4 out of 5 consecutive points fall outside the "X̄±1σ" area, or a continuous upward/downward trend (≥7 points) appears, the parameter is determined to be abnormal.
The control limits of the control chart must be determined through "initial process capability analysis": collect at least 25 groups of data in a stable state, calculate the process mean (X̄) and range mean (R̄/MR̄), and then substitute into the formula to calculate the control limits. Avoid directly using the specification limits as control limits to cause misjudgment.
3.4 Abnormal Early Warning and Closed-Loop Processing Mechanism
Establish a hierarchical early warning and rapid response mechanism to ensure timely handling of abnormalities:
- Early Warning Level Setting: Level 1 Early Warning (Minor Abnormality): A single point exceeds the "X̄±1σ" area but does not exceed the control limit. The SPC platform pops up a yellow warning to remind the operator to pay attention;
- Level 2 Early Warning (Moderate Abnormality): 2 out of 3 consecutive points exceed the "X̄±1σ" area, or the moving range exceeds "MR̄±1σ". The platform pops up an orange warning and sends a text message to the team leader at the same time;
- Level 3 Early Warning (Severe Abnormality): The point exceeds the control limit, or a 7-point continuous trend appears. The platform pops up a red warning, and the reflow oven automatically pauses operation (optional), and notifies the process engineer for emergency handling.
Abnormal Cause Analysis and Processing: For temperature zone abnormalities, priority should be given to checking whether the sensor is offset/damaged (such as thermocouple loosening), whether the heating tube is aging (resistance change exceeds 10%), and whether the hot air circulation fan speed is abnormal (speed deviation ±5%);
After processing, at least 5 groups of data need to be collected to verify the temperature zone stability. The production can be restarted only after the control chart returns to normal.
Improvement Closed-Loop Management: Establish an abnormal handling ledger to record the occurrence time, cause, handling measures and effects of each abnormality;
Statistically analyze the abnormal data every month to identify high-frequency abnormal temperature zones and root causes (for example, frequent abnormalities in a preheating zone may be due to unreasonable heating tube layout), and realize continuous optimization through process improvement (such as adjusting the heating tube power distribution) or equipment transformation.
4. Effect Verification and Optimization of Online SPC Monitoring
Verify the monitoring effect through the following indicators and continuously optimize the SPC plan:
- Process Capability Index (CPK): Monitor the CPK value of the temperature zone temperature deviation, with a target of ≥1.33. After implementing online SPC, the CPK value can usually be increased from 0.8-1.0 to 1.4-1.6, indicating a significant improvement in process stability.
- Abnormality Detection Rate and Response Time: The abnormality detection rate must reach 100%, and the response time (from early warning to processing completion) is ≤15 minutes, which is 50% more efficient than the traditional sampling inspection mode (response time ≥30 minutes).
- Soldering Defect Rate: Count the soldering defect rate (such as cold solder, bridging) before and after implementation, with a target reduction of 30%-50%. For example, after an electronics factory implemented online SPC, the reflow soldering defect rate decreased from 1.2% to 0.5%.
At the same time, it is necessary to dynamically optimize the SPC parameters according to production needs: for example, when the product is switched to lead-free solder, the control limits of the reflow zone need to be readjusted; after the reflow oven is maintained, data needs to be collected again to calculate the control limits to ensure the adaptability of monitoring.
5. Conclusion
Monitoring the temperature zone stability of the reflow oven via online SPC is an important measure to realize "quality controllable and risk preventable" in SMT production. Its core lies in building a closed-loop management system of "data collection - analysis - early warning - improvement". With the development of intelligent manufacturing, online SPC will be deeply integrated with AI algorithms in the future to realize automatic diagnosis of abnormal causes (such as identifying sensor faults and heating tube aging characteristic data through machine learning), and combine digital twin technology to simulate the impact of temperature zone fluctuations on solder joint quality, providing more advanced technical support for the intelligent management and control of reflow soldering processes.