 PCB
PCB FPC
FPC Rigid-Flex
 FR-4
FR-4 HDI PCB
 Rogers High-Frequency Board
 PTFE Teflon High-Frequency Board
 Aluminum
 Copper Core
 PCB Assembly
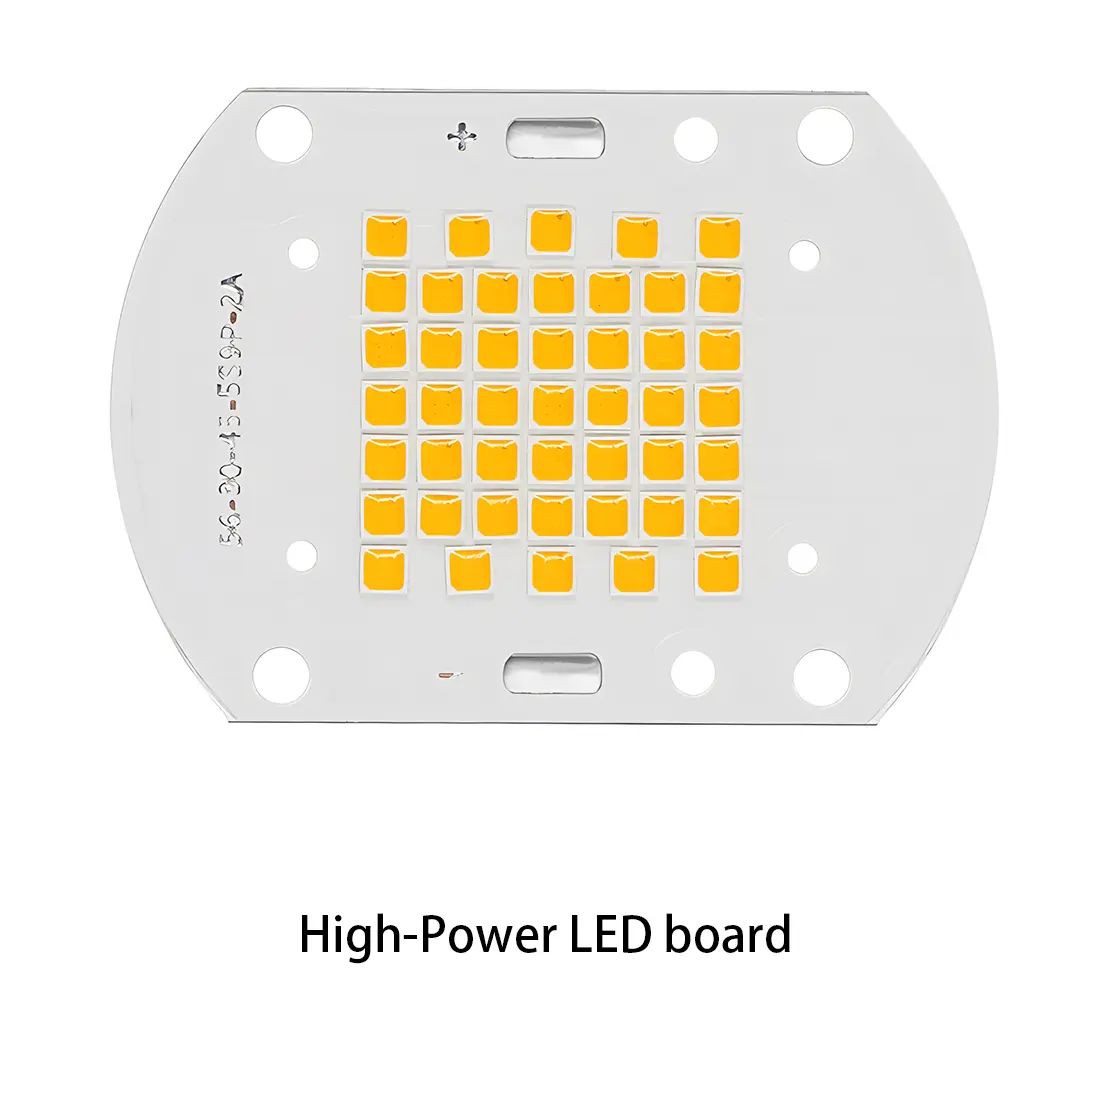 LED light PCBA
 Memory PCBA
 Power Supply PCBA
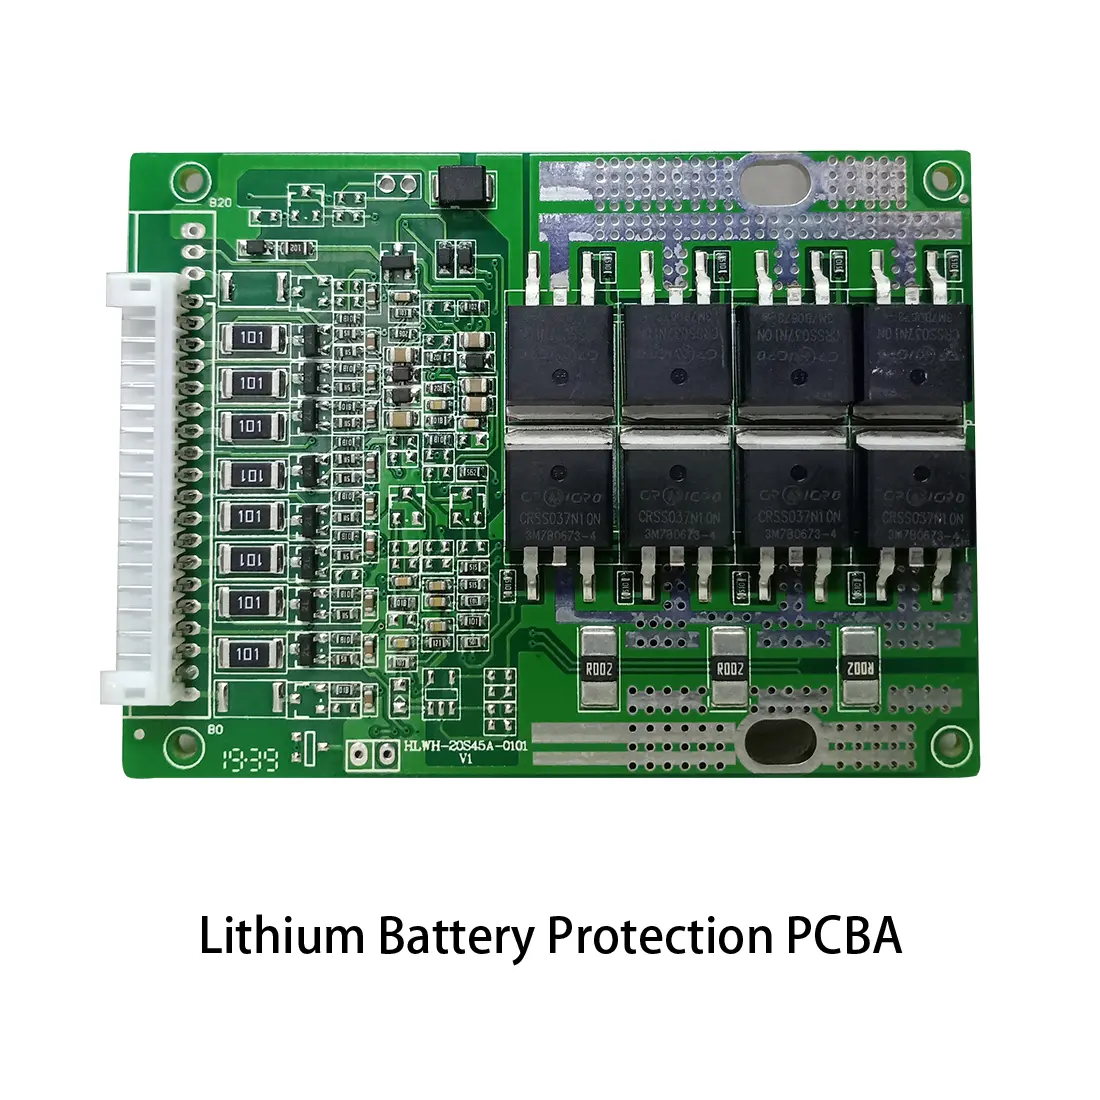 New Energey PCBA
 Communication PCBA
 Industrial Control PCBA
 Medical Equipment PCBA
 Testing Service
 PCBA Testing Service
 Certification Application
 RoHS Certification Application
 REACH Certification Application
 CE Certification Application
 FCC Certification Application
 CQC Certification Application
 UL Certification Application
 Transformers, Inductors
 High Frequency Transformers
 Low Frequency Transformers
 High Power Transformers
 Conversion Transformers
 Sealed Transformers
 Ring Transformers
 Inductors
 Wires,Cables Customized
 Network Cables
 Power Cords
 Antenna Cables
 Coaxial Cables
 Net Position Indicator
 Solar AIS net position indicator
 Capacitors
 Connectors
 Diodes
 Embedded Processors & Controllers
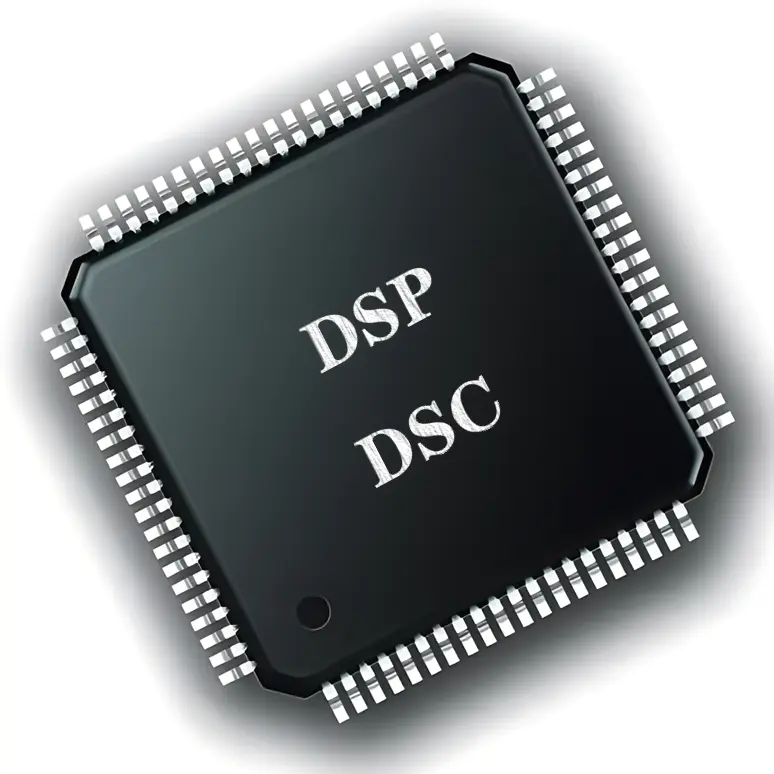 Digital Signal Processors (DSP/DSC)
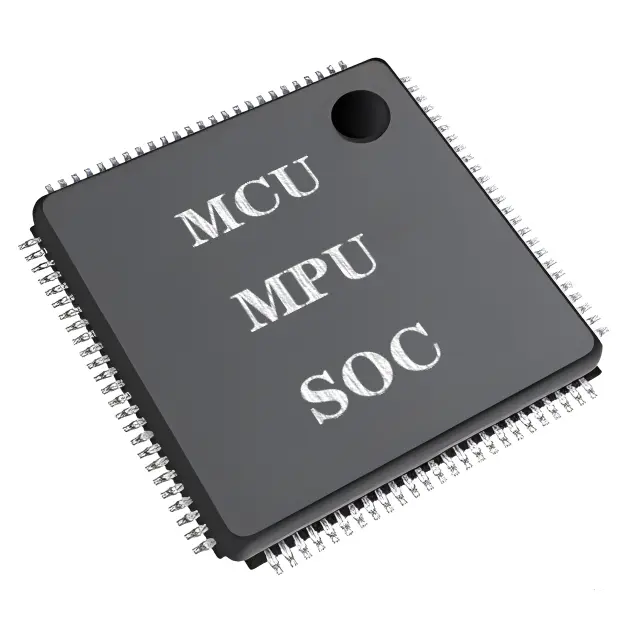 Microcontrollers (MCU/MPU/SOC)
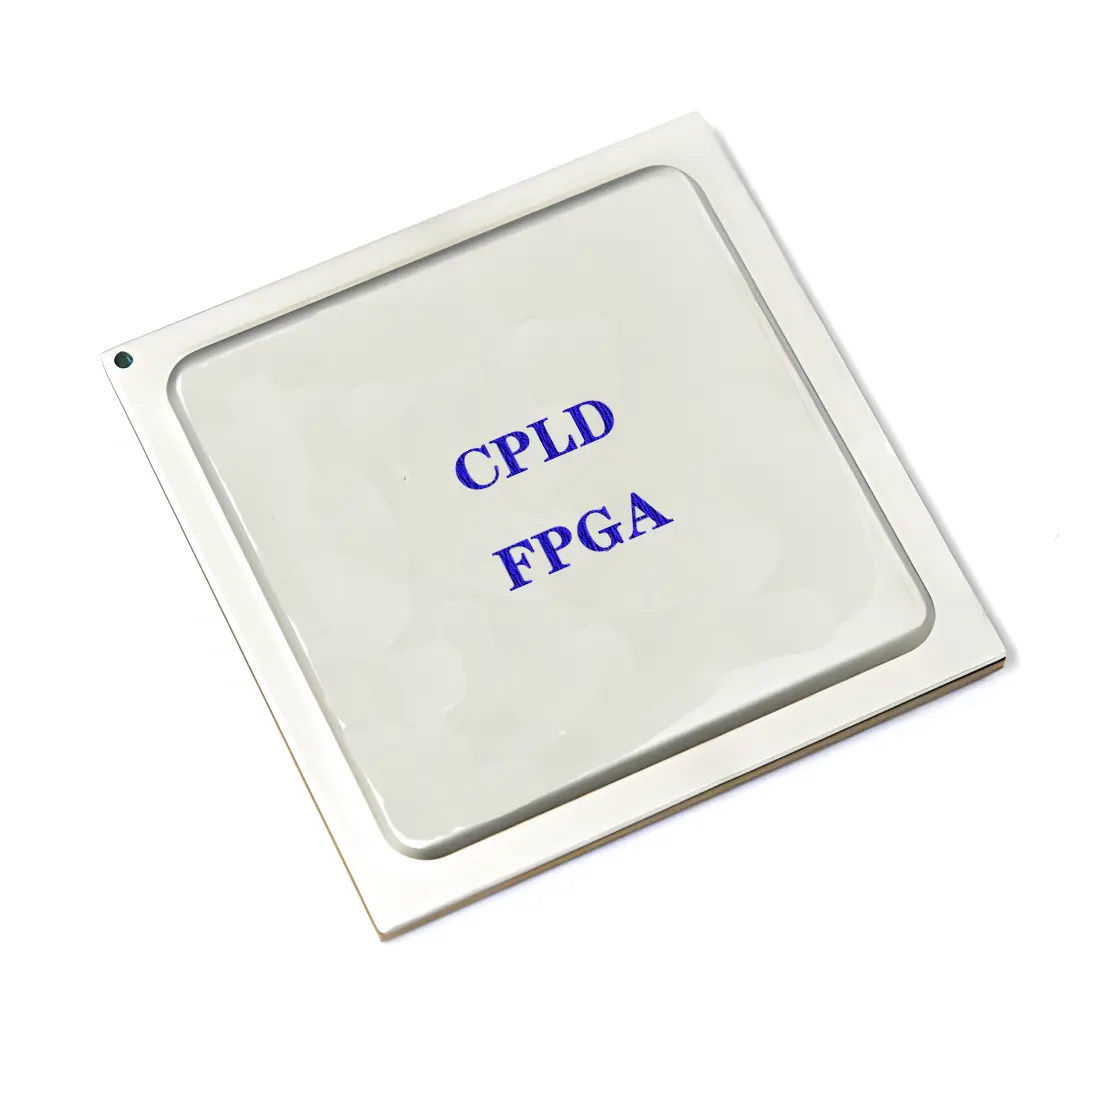 Programmable Logic Device(CPLD/FPGA)
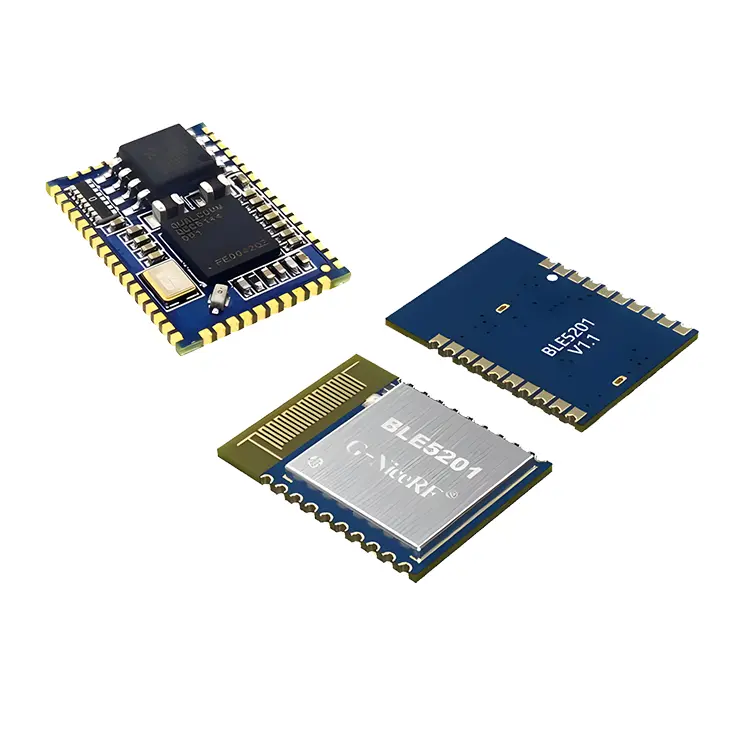 Communication Modules/IoT
 Resistors
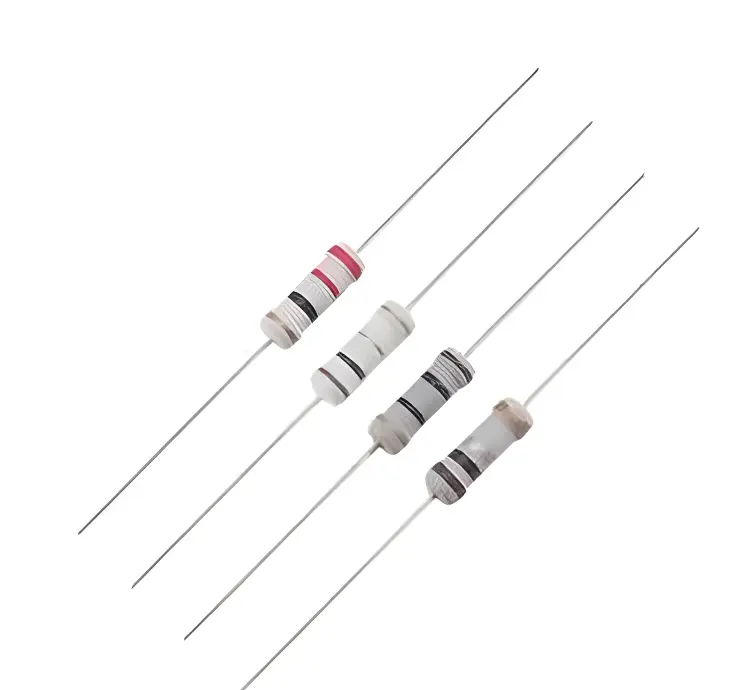 Through Hole Resistors
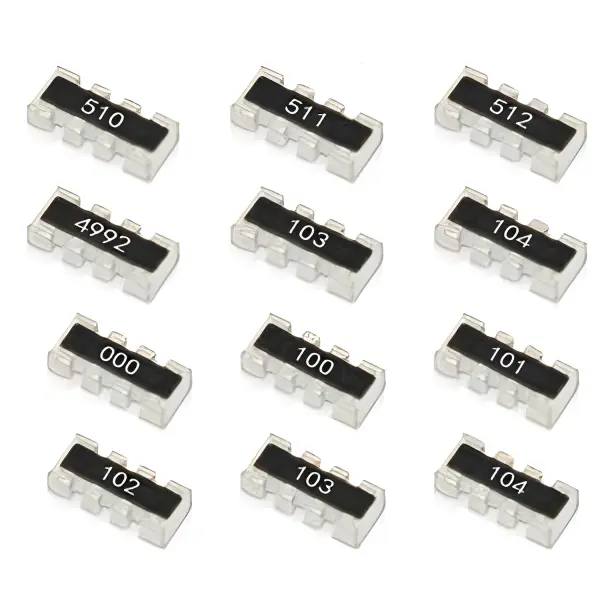 Resistor Networks, Arrays
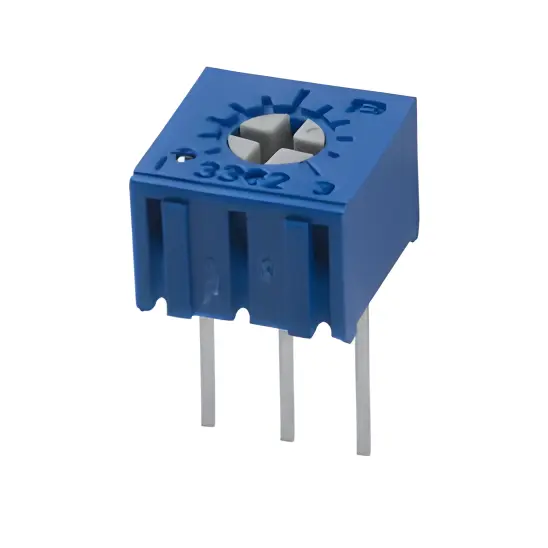 Potentiometers,Variable Resistors
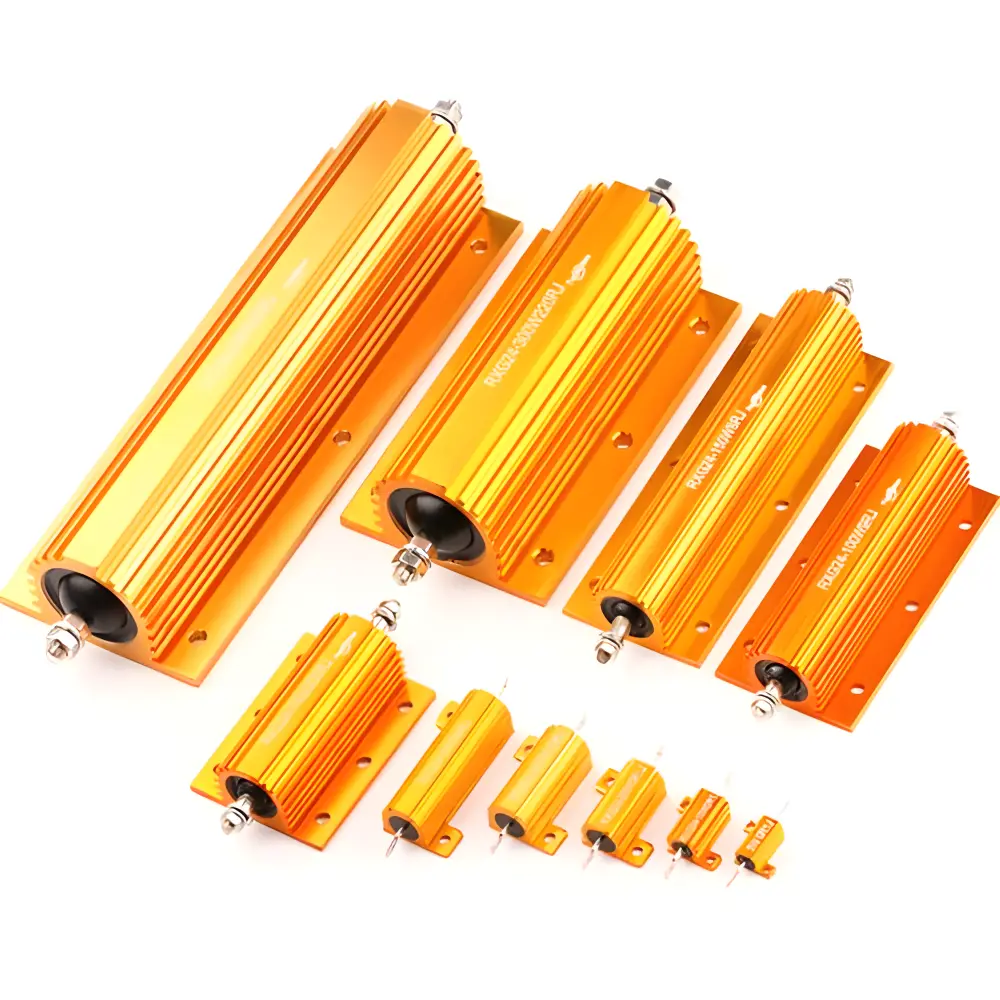 Aluminum Case,Porcelain Tube Resistance
 Current Sense Resistors,Shunt Resistors
 Switches
 Transistors
 Power Modules
 Isolated Power Modules
 AC-DC Power Modules
 DC-AC Module(Inverter)
 RF and Wireless
How to Monitor and Reduce the "Edge Effect" in the Production Process
2026-01-20
In the field of precision manufacturing of PCBs, the edge effect is a common and difficult-to-eradicate process challenge. Its core definition is: during PCB production, affected by factors such as physical field distribution, medium environment, and process parameters, quality differences form between the board edge area and the board center area, specifically manifested as uneven copper layer thickness, circuit precision deviation, solder mask adhesion difference, insufficient etching uniformity, and other issues. Although such differences seem minor, they directly affect the electrical peRFormance (such as impedance stability, conduction reliability), mechanical strength, and service life of PCBs. Especially for high-end products such as HDI (High-Density Interconnect) boards, flexible PCBs, and high-frequency and high-speed PCBs, quality fluctuations caused by the edge effect may lead to direct product scrapping, significantly increasing production costs.
Industry data shows that local quality defects caused by the edge effect account for 15%-20% of PCB production. Among them, the copper layer thickness difference between the edge and center of complex board types can exceed 20%, far exceeding the ±10% error range allowed by IPC standards. Therefore, accurately identifying the generation mechanism of the edge effect, establishing a scientific monitoring system, and implementing targeted control strategies are crucial for PCB enterprises to improve product consistency, reduce scrap rates, and enhance market competitiveness. Combining actual PCB production scenarios, this article will deeply analyze the control path of quality differences between board edges and centers from four dimensions: the core causes of the edge effect, its manifestations in the entire process, precise monitoring methods, and systematic reduction strategies, providing enterprises with actionable technical solutions.
I. Core Causes and Full-Process Manifestations of PCB Edge Effect
The edge effect is essentially the result of the combined action of "uneven field distribution" and "process environment differences". PCB production involves multiple processes relying on physical fields (electric field, magnetic field, flow field) and chemical media, such as electroplating, etching, exposure, and solder masking. As the board edge area is located at the "field boundary" or "medium interface", it has inherent differences in the intensity of force, heat, and chemical action compared with the board center area. Coupled with factors like material properties and equipment precision, quality deviations are ultimately induced. The causes and manifestations of the edge effect vary across different processes and thus require separate analysis.
(I)Classification and Analysis of Core Causes
The causes of the edge effect can be summarized into four categories: physical field effect, medium environment difference, process operation deviation, and material property influence. These causes are interrelated and superimposed, jointly exacerbating quality differences.
1. Uneven physical field distribution: This is the core cause of the edge effect, permeating key processes such as electroplating, etching, and exposure. Under the action of an electric field (e.g., electroplating and electrolytic etching), the current density in the PCB edge area is significantly higher than that in the center. According to electromagnetic principles, the electric field intensity at the conductor edge accumulates due to the "edge effect" (corrected from "point effect"), resulting in a current density 30%-50% higher at the edge than at the center. This further leads to excessive copper deposition rate (during electroplating) or excessive etching rate (during electrolytic etching), causing thickness variations. In a flow field environment (e.g., chemical etching and developing), the convection exchange between the board edge and the solution is more sufficient, enabling rapid replenishment of fresh chemicals and timely discharge of reaction products. In contrast, the solution convection in the board center is weak, easily forming "reaction dead zones" that lead to differences in etching rate and developing degree. Additionally, during the exposure process, the board edge area is affected by ambient light interference and ultraviolet reflection angles, resulting in exposure energy deviation from the center area and subsequent differences in circuit resolution.
2. Medium environment differences: In the chemical processes of PCB production (electroplating, etching, copper deposition, etc.), the chemical medium conditions differ between the board edge and center. The board edge is close to the chemical tank wall, making it more susceptible to tank wall temperature fluctuations and chemical concentration gradients, while the chemical temperature and concentration in the board center are more stable. Meanwhile, when the board edge moves in the chemical solution (e.g., during shaking and stirring), it endures greater fluid dynamics, facilitating faster chemical renewal. In contrast, chemical renewal in the center relies on diffusion, which is slower, leading to inconsistent chemical reaction rates. For instance, during chemical etching, the etchant concentration at the board edge remains high, resulting in a fast etching rate. In the center area, the etchant concentration decreases due to reaction consumption, slowing down the etching rate. Eventually, this causes over-etching of circuits at the board edge and residual circuits in the center.
3. Process operation and equipment deviations: Insufficient operating specifications and equipment precision in production will further amplify the edge effect. During board cutting and clamping, stress concentration and slight deformation are likely to occur at the board edge, leading to positioning deviations in subsequent processes and reduced adaptability of process parameters between the edge and center. Unreasonable design of electroplating hangers and etching baskets results in inconsistent stress and contact resistance between the board edge and center, affecting current distribution uniformity. Performance defects of equipment stirring systems and temperature control systems—such as uneven rotation speed of stirring blades and irrational distribution of heating pipes—exacerbate environmental differences between the edge and center, amplifying quality deviations.
4. Material property influence: Differences in the physical properties of PCB substrates (copper-clad laminates) can also induce the edge effect. Slight variations in copper foil adhesion and resin density may exist between the edge and center of copper-clad laminates. During electroplating and etching, the edge copper foil is more prone to peeling and over-etching. The substrate of flexible PCBs has high flexibility, so the board edge is susceptible to bending and stretching during production, resulting in different circuit deformation compared to the center area. Furthermore, if the warpage and surface roughness of the substrate edge exceed standards, it will affect the uniformity of dry film lamination and solder mask coating, further worsening quality differences between the edge and center.
(II)Full-Process Manifestations of Edge Effect
The edge effect runs through the entire PCB production process, from pre-cutting and drilling, to middle electroplating, etching, and circuit production, and then to post-solder masking, silk-screen printing, and profiling, presenting different quality problems. The specific manifestations are as follows:
1. Cutting and drilling processes: After cutting, burrs and chipping are likely to occur at the PCB edge, while the center area maintains a flat edge. These burrs will affect subsequent dry film lamination and circuit production precision. During drilling, the hole position deviation rate at the board edge is significantly higher than that at the center, and the hole wall roughness is also greater. Due to stress concentration at the edge, the drill bit endures uneven force during drilling, easily causing hole position offset and hole wall delamination. In contrast, the board material in the center is subjected to stable force, ensuring better drilling quality. Additionally, removing burrs at the hole mouth of edge drilling is more challenging, and residual iMPUrities will affect copper deposition and electroplating results.
2. Copper deposition and electroplating processes: These are the processes where the edge effect is most prominent. During copper deposition, the adhesion of the copper layer on the hole wall at the board edge is lower than that at the center, and the copper layer is thinner. This is because sufficient chemical convection at the edge accelerates the copper deposition reaction, resulting in less dense copper layer crystallization, while the copper deposition reaction in the center is stable, ensuring better copper layer quality. During electroplating, the copper layer at the board edge is much thicker than that in the center, forming a "thick edge, thin center" phenomenon. For some high-end PCBs, the copper layer thickness at the edge can even reach 1.5 times that of the center, leading to impedance deviation from design requirements and affecting signal transmission stability. Meanwhile, the electroplating layer at the edge is prone to pinholes and pitting, while the center electroplating layer is more uniform and dense.
3. Circuit production processes (dry film, exposure, development, etching): During dry film lamination, bubbles and wrinkles are likely to form in the dry film at the board edge, while the center area adheres tightly. These bubbles and wrinkles will cause short circuits and open circuits after exposure. During exposure, insufficient or excessive exposure energy at the edge leads to blurred circuit edges and line width deviation, while the center area maintains higher circuit resolution. In the developing process, over-development at the edge results in serrated circuit edges, while the center area is fully developed with flat circuits. During etching, over-etching at the edge reduces line width, and residual circuits in the center form a "thin edge, thick center" line width difference, which may cause poor circuit conduction in severe cases.
4. Solder masking and silk-screen printing processes: During solder mask coating, the solder mask ink at the board edge is thinner with insufficient adhesion, making it prone to peeling and cracking, while the center solder mask layer has uniform thickness and strong adhesion. This is because the high fluidity of the medium at the edge causes ink to spread around, reducing thickness. During silk-screen printing, logos at the edge are prone to blurring and shifting, while center logos are clear and accurately positioned—this is the combined result of edge positioning deviations and ink diffusion effects.
5. Profiling and testing processes: During profiling, stress cracking and warpage are likely to occur at the board edge, while the center area maintains a stable shape. Stress cracking reduces the PCB's mechanical strength and affects subsequent component assembly. During testing, the qualification rate of insulation resistance and conduction performance in the edge area is lower than that in the center, and impedance stability is poor. This is the final manifestation of accumulated edge effects from previous processes and one of the main causes of product scrapping.
II. Precise Monitoring Methods and System Construction for PCB Edge Effect
Monitoring is the premise of edge effect control. It is essential to establish a "full-process, multi-dimensional, high-precision" monitoring system to achieve whole-chain monitoring from process parameters to finished product quality, timely capture quality differences between edges and centers, and provide data support for subsequent optimization strategies. The construction of the monitoring system should align with the process characteristics of each step, selecting monitoring indicators, equipment, and methods in a targeted manner.
(I)Core Monitoring Indicators and Testing Standards
The monitoring indicators of the edge effect should cover three categories: electrical performance, physical dimensions, and appearance quality. It is necessary to clarify the allowable range of differences between the board edge and center, and formulate testing specifications with reference to IPC standards (such as IPC-6012, IPC-2221) and internal enterprise quality standards.
1. Electrical performance indicators: Core indicators include copper layer thickness difference, impedance deviation, insulation resistance difference, and conduction reliability. The copper layer thickness difference should be controlled within ±10% (±5% for high-end PCBs). An XRF (X-Ray Fluorescence Spectrometer) is used to detect the copper layer thickness at the board edge, center, and quarter positions, and the difference is calculated accordingly. The impedance deviation is controlled within ±5%—an impedance tester is used to detect the characteristic impedance of circuits at the edge and center separately, and the difference is compared. The insulation resistance difference should not exceed 10%, with an insulation resistance tester used to detect the insulation performance between the edge and center. Conduction reliability is tested by a flying probe tester to ensure no open circuits or short circuits in the edge and center circuits.
2. Physical dimension indicators: These include line width and spacing deviation, hole position deviation, board edge burr size, and solder mask thickness difference. The line width and spacing deviation is controlled within ±0.02mm (±0.01mm for high-density PCBs). An optical microscope or AOI (Automatic Optical Inspection) equipment is used to measure the line width and spacing of edge and center circuits. The hole position deviation is controlled within ±0.03mm—X-Ray detection equipment is used to detect the actual position of edge and center holes and compare them with the design datum. The board edge burr size should not exceed 0.05mm, measured by microscope observation. The solder mask thickness difference is controlled within 15%, with a coating thickness gauge used to detect the solder mask thickness between the edge and center.
3. Appearance quality indicators: These include circuit edge roughness, solder mask adhesion, board edge warpage, and hole wall quality. The circuit edge roughness should not exceed 0.01mm, observed via SEM (Scanning Electron Microscope). The solder mask adhesion is tested by the cross-cut test method, with both edge and center adhesion grades required to reach 4B or higher (no peeling). The board edge warpage is controlled within 0.5%, detected by a flatness tester. The hole wall should be free of delamination, burrs, and voids, observed by X-Ray and hole wall detectors.
(II)Full-Process Monitoring Methods and Equipment Configuration
According to the characteristics of the edge effect in different processes, a combination of "online monitoring + offline testing" is adopted, with high-precision testing equipment configured to achieve real-time monitoring and data traceability.
1. Pre-processes (cutting, drilling): The cutting process uses an online visual inspection system to monitor edge burrs and chipping in real time, triggering an alarm and adjusting cutting parameters immediately when standards are exceeded. The drilling process is equipped with X-Ray positioning detection equipment to monitor hole position deviation between the edge and center in real time. Meanwhile, a drilling quality detector is used to check hole wall roughness and hole mouth burrs—5-10 samples are randomly selected from each batch to focus on testing the drilling quality of the edge area. Additionally, a stress tester is used to detect the stress distribution of the board edge after cutting, enabling timely identification of stress concentration issues and preventing quality deviations in subsequent processes.
2. Middle processes (copper deposition, electroplating, circuit production): The copper deposition process adopts an online copper layer thickness monitor to detect the copper deposition thickness between the edge and center in real time. It also monitors parameters such as chemical concentration, temperature, and stirring speed, establishing a correlation model between these parameters and thickness differences. The electroplating process is equipped with a current density distribution monitor to track real-time current density changes between the edge and center, controlling the difference within 10%. An XRF detector is used for offline sampling inspection of copper layer thickness, with 1 batch sampled every hour and 8 points (including edge, center, and diagonal) tested per sample. In the circuit production process, an exposure energy tester is used during exposure to detect the exposure energy of the edge and center separately, controlling the deviation within ±3%. The developing and etching processes are equipped with online AOI equipment to monitor circuit edge roughness and line width deviation in real time—when the edge-center difference exceeds standards, parameters such as developing time and etching speed are adjusted immediately.
3. Post-processes (solder masking, silk-screen printing, profiling, testing): The solder masking process uses a coating thickness gauge for online detection of the solder mask thickness between the edge and center. An adhesion tester is used for offline sampling inspection of solder mask adhesion, with 3-5 samples taken per batch. The silk-screen printing process is equipped with a visual positioning system to monitor the position deviation of edge logos in real time, avoiding blurring and shifting. The profiling process uses a flatness tester to detect edge warpage and a visual inspection system to monitor edge stress cracking. The testing process employs a flying probe tester, impedance tester, and insulation resistance tester to conduct a full inspection of the electrical performance of edge and center areas, generating test reports and marking difference points.
(III)Construction and Data Application of Monitoring System
To build a robust monitoring system, it is necessary to achieve "equipment linkage, data integration, and closed-loop management", summarizing and analyzing monitoring data from each process to form an edge effect control database that supports process optimization.
1. Establish an information-based monitoring platform: Integrate MES (Manufacturing Execution System) and QMS (Quality Management System) to upload real-time detection data, equipment parameters, and operation records from each process to the platform, enabling visual data management. The platform should feature data statistics, trend analysis, and abnormal alarm functions, automatically generating edge-center quality difference reports to intuitively present the variation trend of the edge effect across each process.
2. Formulate a hierarchical monitoring strategy: Implement high-frequency monitoring for key processes (electroplating, etching, exposure)—1 sampling inspection per hour for electroplating and 1 every 2 hours for etching and exposure. Conduct regular monitoring for general processes (cutting, silk-screen printing) with 1 sampling inspection per batch. Meanwhile, perform 100% inspection for high-end PCBs and sampling inspection for ordinary products, with the sampling ratio adjusted based on product complexity (≥10% for complex board types and ≥5% for ordinary ones).
3. Data traceability and correlation analysis: Establish a monitoring data traceability file for each batch of products, recording detection time, inspectors, equipment numbers, and detection results to facilitate rapid cause tracing when problems occur. Conduct correlation analysis on monitoring data to explore the relationship between process parameters (e.g., current density, exposure energy, stirring speed) and the edge effect, establishing a mathematical model to predict the impact of parameter changes on the edge effect and provide data support for process optimization.
III. Systematic Strategies and Implementation Measures for Reducing PCB Edge Effect
Reducing the edge effect requires efforts in four dimensions: "process parameter optimization, equipment improvement, operation standardization, and material control". Combined with the causes and monitoring data of each process, targeted measures are implemented to achieve whole-chain optimization from source suppression and process control to end correction, narrowing the quality difference between the board edge and center.
(I)Process Parameter Optimization: Suppressing Edge Effect from the Source
Process parameters are the core factors affecting the edge effect. It is necessary to optimize parameter settings through experiments combined with monitoring data, balance the process environment between the edge and center, and suppress the occurrence of differences.
1. Optimization of electroplating process parameters: To address uneven current density distribution, a "segmented current control" strategy is adopted—lower current density for the edge area and higher for the center. By adjusting the hanger position and current distribution, the current density difference between the edge and center is controlled within 10%. Optimize the electroplating solution composition by adding leveling agents and brighteners to improve copper layer deposition uniformity and reduce excessive edge copper deposition. Adjust electroplating time and temperature: appropriately shorten the actual electroplating time for the edge area based on the deposition rate difference between the edge and center, and control the electroplating solution temperature uniformity to avoid a temperature difference exceeding 2℃ between the tank wall and center.
2. Optimization of etching process parameters: In chemical etching, optimize chemical concentration and stirring speed, adopting a "gradient stirring" method with a slightly lower speed at the edge and higher at the center to balance chemical convection differences. Adjust etching time and implement a segmented etching process based on the edge-center etching rate difference to prevent edge over-etching and center residue. In electrolytic etching, optimize the electrode layout and add auxiliary electrodes to disperse edge current density, reducing excessive edge etching speed.
3. Optimization of exposure process parameters: To resolve exposure energy deviation at the edge, adjust the exposure machine's light source distribution—add a light shield in the edge area or adjust the light source angle to control the edge-center exposure energy difference within ±3%. Optimize exposure time by appropriately adjusting it based on the exposure sensitivity difference between the edge and center to ensure consistent circuit resolution. Adopt "zonal exposure" technology to set separate exposure parameters for the edge and center areas, adapting to the exposure requirements of different regions.
4. Optimization of solder masking and silk-screen printing process parameters: During solder mask coating, adopt a "gradient coating" process with a slightly thicker coating at the edge than the center to compensate for thickness loss caused by subsequent diffusion. Optimize ink viscosity and coating speed to reduce edge ink diffusion. In silk-screen printing, optimize screen tension and printing pressure—use a slightly lower pressure at the edge to avoid ink blurring—and adjust the positioning datum to improve the positioning accuracy of edge logos.
(II)Equipment Improvement and Tooling Optimization: Improving Process Stability
Equipment transformation and tooling design optimization can improve the consistency of the process environment between the edge and center, reducing the amplification effect of equipment factors on the edge effect.
1. Improvement of electroplating and etching equipment: Transform the electroplating tank's stirring system by adopting a "multi-point stirring + deflector" design—install deflectors in the tank to guide uniform chemical flow, reducing edge-center convection differences. Optimize the electrode layout by replacing traditional flat electrodes with arc electrodes to disperse edge current density, and add auxiliary anodes to balance the electric field distribution between the edge and center. Install a chemical circulation system in the etching tank to ensure uniform chemical concentration and temperature, avoiding excessive chemical renewal in the edge area.
2. Improvement of exposure and testing equipment: Upgrade the exposure machine's light source system by replacing traditional mercury lamps with LED surface light sources to improve exposure energy distribution uniformity. Install a temperature and humidity control system in the exposure machine to prevent the edge area from being affected by ambient temperature and humidity. Enhance the detection accuracy of AOI, XRF, and other testing equipment, increasing detection points in the edge area to improve difference identification sensitivity.
3. Tooling fixture optimization: Design special electroplating hangers with an "elastic contact" structure to ensure consistent contact resistance between the edge and center, reducing current distribution deviations. Optimize etching baskets by adding buffer devices at the edges to reduce friction and stress concentration between the board edge and the basket. Adopt a "multi-point positioning" design for drilling tooling to reduce edge positioning deviations and improve drilling accuracy. Use "double-edge cutting" technology for cutting tooling to minimize edge burrs and stress concentration.
(III)Operation Standardization and Process Control: Reducing Human and Environmental Impacts
Standardizing operating procedures and controlling the production environment can effectively reduce the impact of human factors on the edge effect, ensuring the stable implementation of process parameters.
1. Standardize operating procedures: Formulate standardized operating instructions (SOP) for each process, clarifying edge area operation points—such as board positioning during cutting, hanger installation during electroplating, and positioning datum adjustment during silk-screen printing. Strengthen employee training to improve operational skills, ensuring employees can accurately control process parameters and identify early signs of the edge effect. Establish an operation responsibility traceability system to analyze the causes of edge effect deviations due to operational errors and formulate improvement measures.
2. Production environment control: Maintain uniform workshop temperature and humidity, controlling the edge-center difference within ±1℃ and ±3%RH to avoid environmental impacts on process stability. Strengthen workshop cleanliness management to reduce dust pollution in the edge area, preventing defects during dry film lamination and solder mask coating. Perform regular daily equipment maintenance, calibrating the stirring system, temperature control system, and electrode system to ensure stable equipment performance and minimize parameter fluctuations.
3. Process quality control: Establish a three-level control mechanism of "first article inspection + process patrol inspection + last article review". The first article inspection focuses on comparing edge-center quality differences to confirm process parameter adaptability. Process patrol inspections regularly sample edge area quality indicators to detect abnormalities and adjust parameters in a timely manner. The last article review summarizes the edge effect control effect of the entire batch, providing a reference for the next batch's production.
(IV)Material Control and Design Optimization: Reducing Risks from the Source
Optimizing PCB design and strictly controlling material quality can reduce the risk of edge effect occurrence and improve product adaptability to process fluctuations.
1. PCB design optimization: Optimize circuit layout to avoid excessive circuit concentration in the edge area, reserving sufficient process margin (generally ≥5mm) at the edge to reduce the edge effect's impact on key circuits. Reasonably set line width and spacing—make the edge line width slightly larger than the center to compensate for over-etching loss during etching. Optimize hole diameter and pad design, ensuring the distance between edge holes and the board edge is ≥3mm to avoid edge stress concentration caused by overly close holes. For high-density PCBs, adopt a "zonal design" strategy, appropriately differentiating circuit density and hole diameter between the edge and center to adapt to the process characteristics of different regions.
2. Material quality control: Strictly select copper-clad laminate suppliers to ensure consistent copper foil adhesion and resin density between the edge and center of the substrate. Sample inspect copper-clad laminate warpage and surface roughness, prohibiting unqualified materials from being put into storage. Select dry films and solder mask inks with strong adaptability to ensure consistent lamination and adhesion in both edge and center areas. Strengthen material storage management to prevent substrate edge moisture absorption and deformation, which would affect subsequent process quality.
(V)End Correction Measures: Reducing Defective Product Loss
For products with existing edge effects, targeted end correction measures are adopted to reduce scrap loss and improve product qualification rates.
1. Copper layer thickness correction: For products with excessive edge copper layer thickness, adopt a micro-etching process to accurately control etching time and speed, removing excess edge copper to meet thickness standards. For products with insufficient edge copper layer thickness, use local electroplating to supplement copper thickness and avoid overall scrapping.
2. Circuit and solder mask correction: For products with edge circuit over-etching and blurred edges, use laser trimming technology to accurately repair circuit edges and improve line width precision. For edge areas with insufficient solder mask adhesion and peeling, perform local solder mask re-coating, and test adhesion after re-curing before proceeding to the next process.
3. Board edge processing: For products with edge burrs and chipping, adopt grinding and polishing processes to remove burrs and restore edge flatness. For products with edge warpage, use hot-press correction technology to adjust edge flatness and meet assembly requirements.
IV. Implementation Guarantee and Effect Evaluation of Edge Effect Control
Edge effect control is a long-term, systematic task. It is necessary to establish a sound implementation guarantee mechanism to ensure the effective execution of various strategies. Meanwhile, scientific effect evaluation is conducted to continuously optimize the control plan, realizing dynamic control of the edge effect.
(I)Implementation Guarantee Mechanism
1. Organizational guarantee: Establish a special edge effect control team consisting of personnel from the technology, production, quality, and equipment departments, clarifying each department's responsibilities. The technology department is responsible for process parameter optimization and design improvement; the production department for standardized operation and process control; the quality department for monitoring, testing, and data analysis; and the equipment department for equipment transformation and maintenance—coordinating to promote control work.
2. Technical guarantee: Establish a technical R&D team focusing on edge effect control technology research and application, tracking advanced industry technologies (e.g., new electroplating processes, intelligent monitoring equipment) for timely introduction and optimization. Strengthen cooperation with universities and research institutions to conduct special research on edge effect causes and control technologies, improving the enterprise's technical capabilities.
3. Financial guarantee: Arrange reasonable capital investment for equipment transformation, tooling optimization, testing equipment upgrading, and employee training to support edge effect control. Allocate a certain proportion of the scrap cost savings from edge effect control to subsequent control work, forming a virtuous cycle.
4. Assessment guarantee: Incorporate edge effect control indicators (e.g., copper layer thickness difference qualification rate, circuit precision qualification rate) into each department's performance assessment, setting reasonable targets. Reward teams that exceed targets and penalize those that fail to meet them to stimulate the enthusiasm of all employees to participate in control work.
(II)Control Effect Evaluation Methods
Quantitative indicators are used to evaluate the edge effect control effect, with regular reviews and optimizations to ensure the effectiveness and sustainability of control measures.
1. Quantitative indicator evaluation: Core evaluation indicators include the edge-center quality difference qualification rate, edge effect-induced scrap rate, and process parameter stability. The difference qualification rate should be increased to over 95% (≥98% for high-end PCBs), the scrap rate controlled within 2%, and the process parameter fluctuation range within ±5%. Evaluate the control effect by comparing indicator data before and after implementation.
2. Customer feedback evaluation: Collect customer feedback on product edge area quality, counting the edge effect-induced customer complaint rate (controlled within 0.5%). Optimize control measures based on customer feedback.
3. Long-term trend evaluation: Analyze the long-term variation trend of the edge effect using historical monitoring platform data to evaluate the stability and sustainability of control measures. Timely identify new problems and adjust control strategies accordingly.