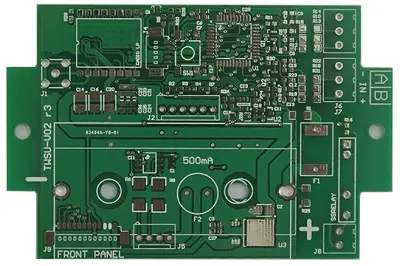
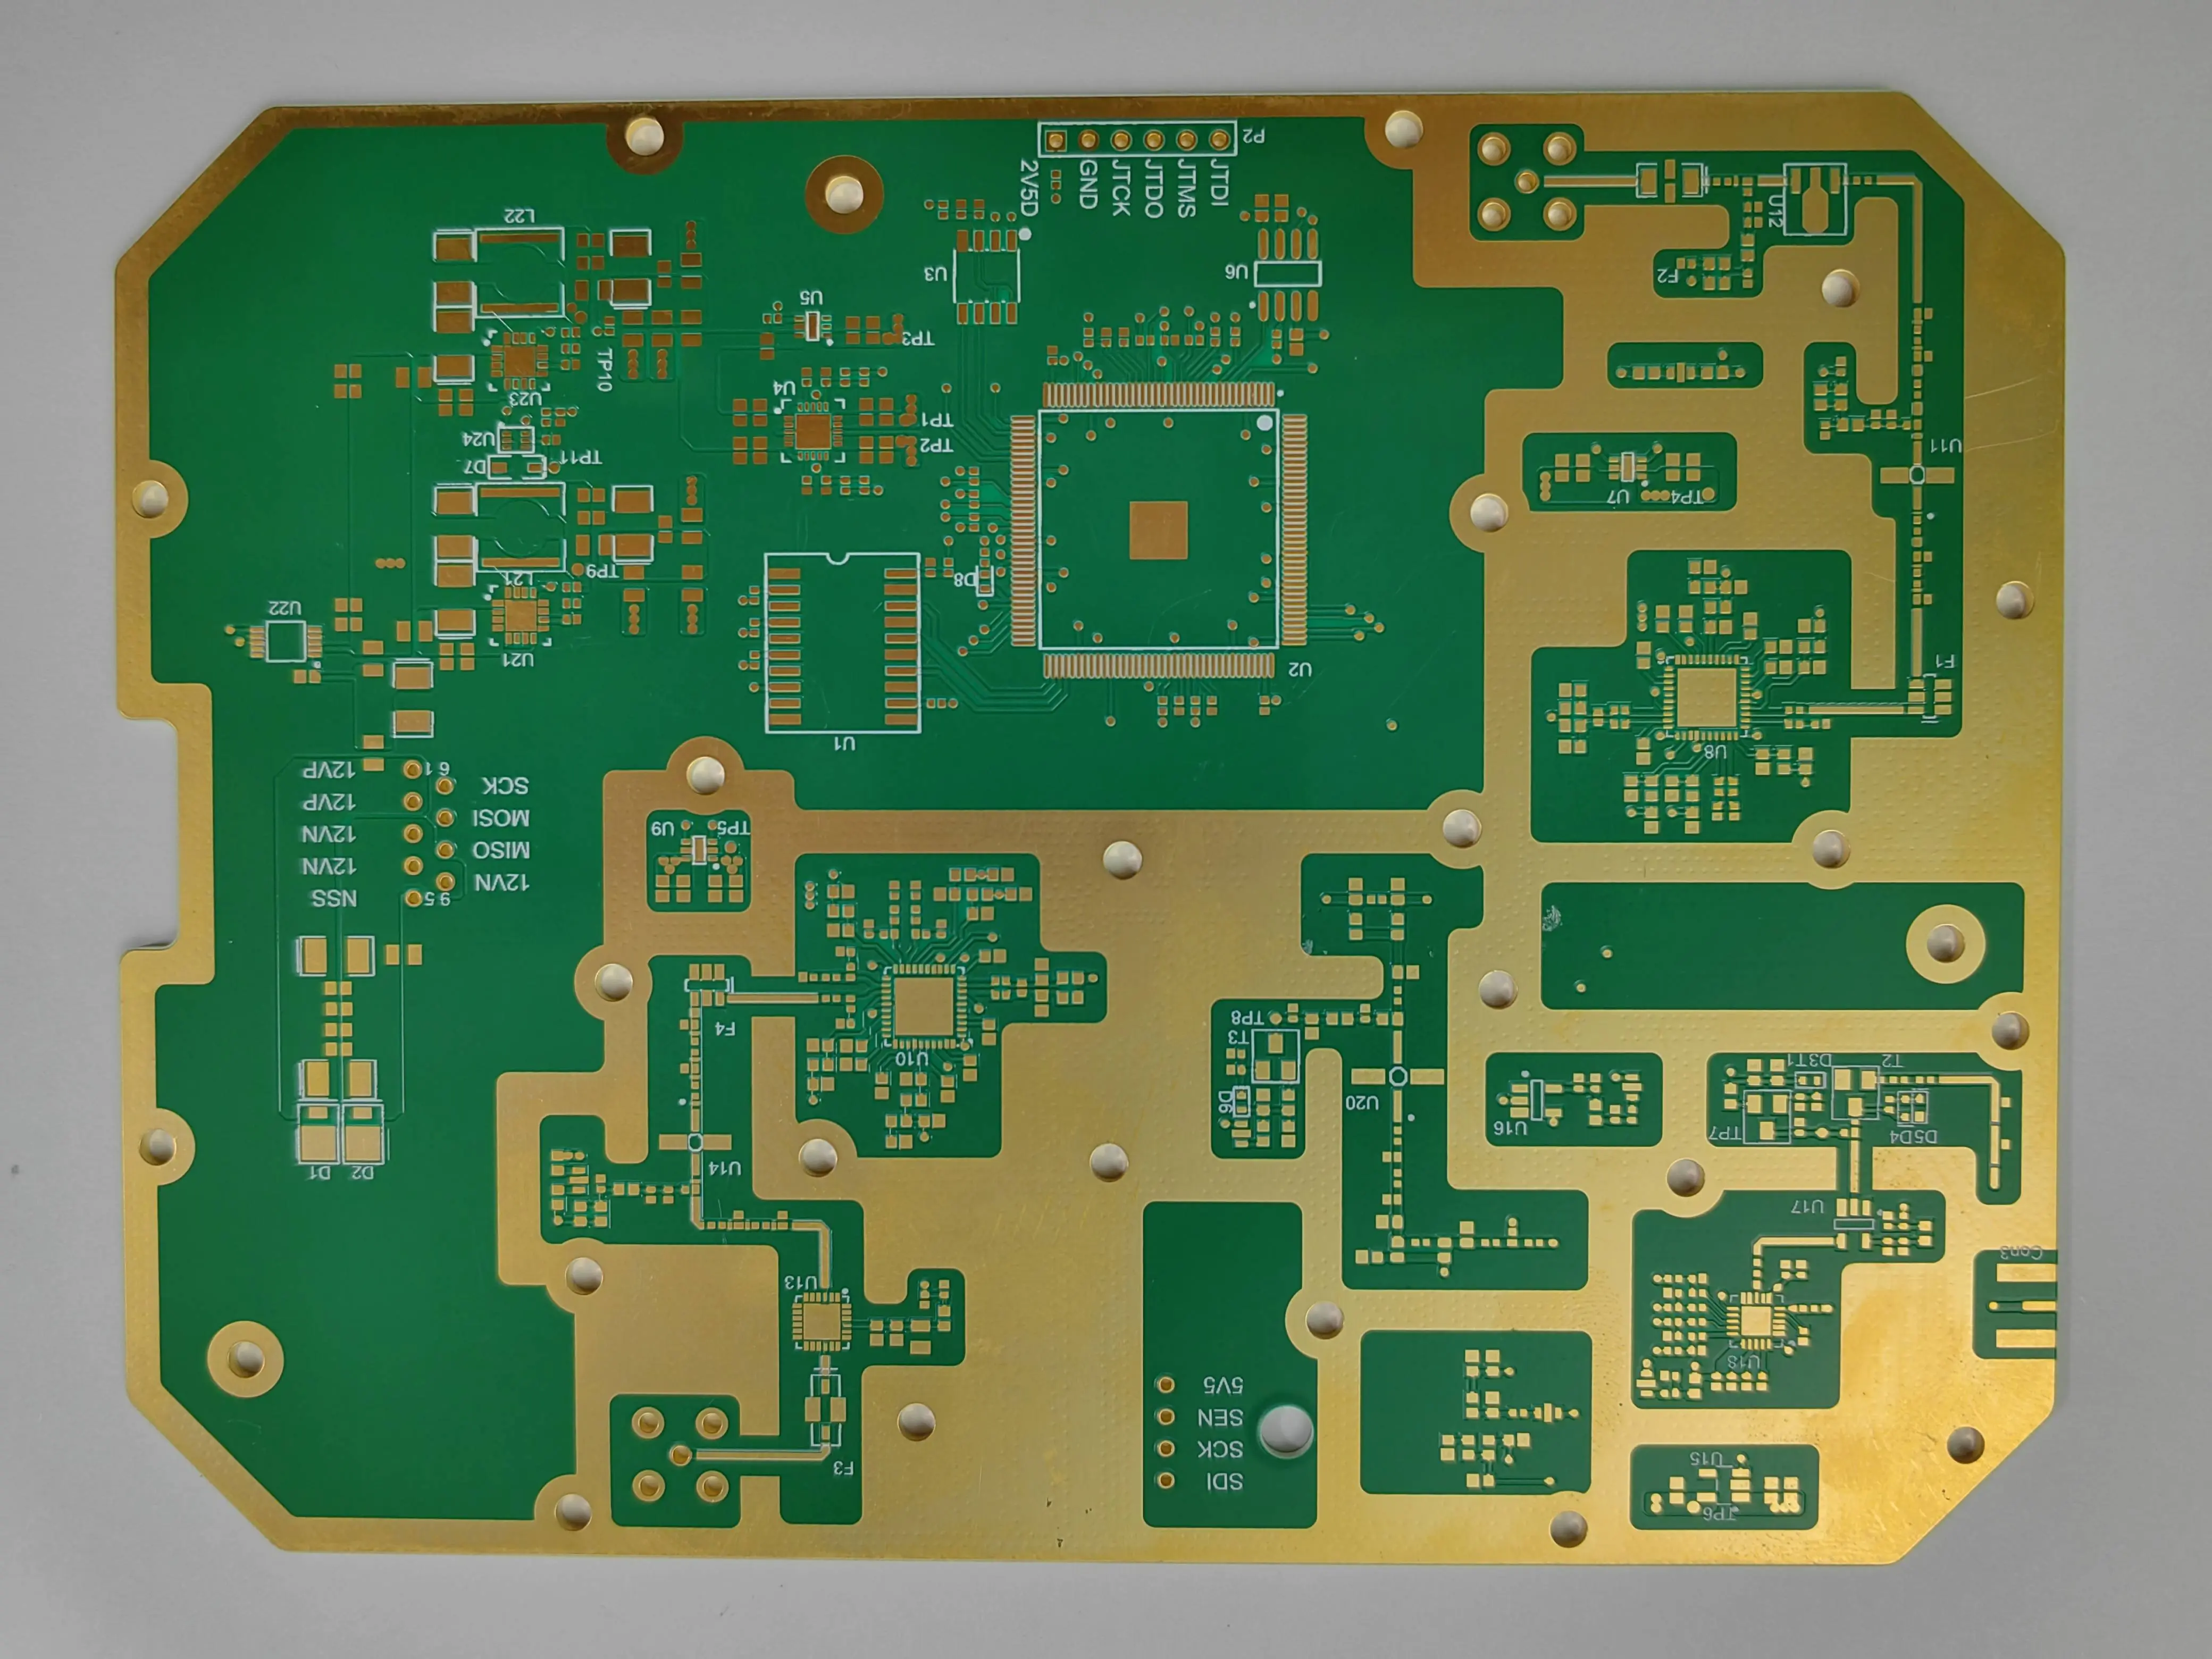
 PCB
PCB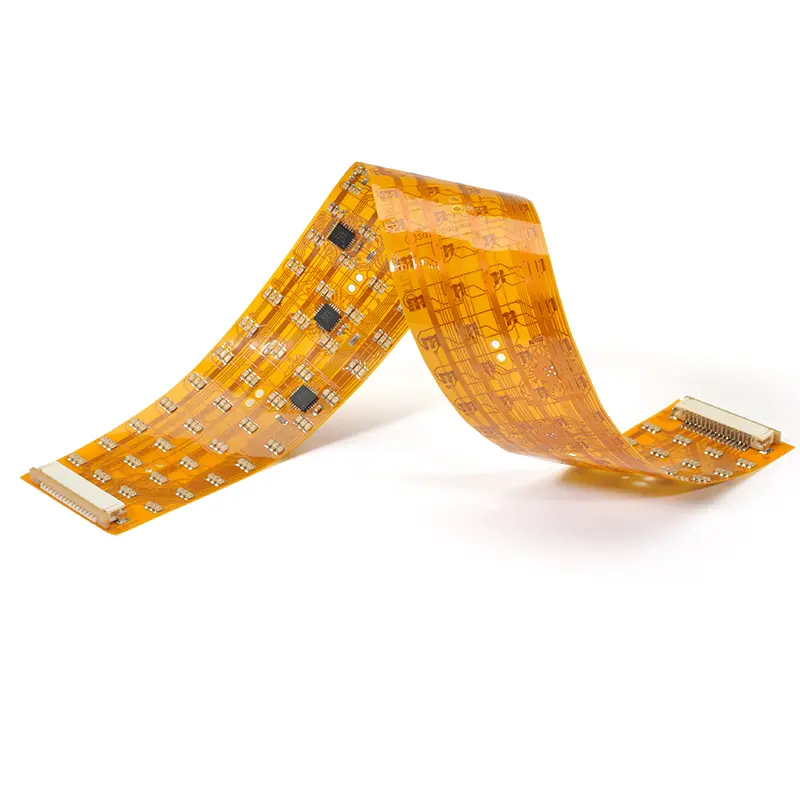 FPC
FPC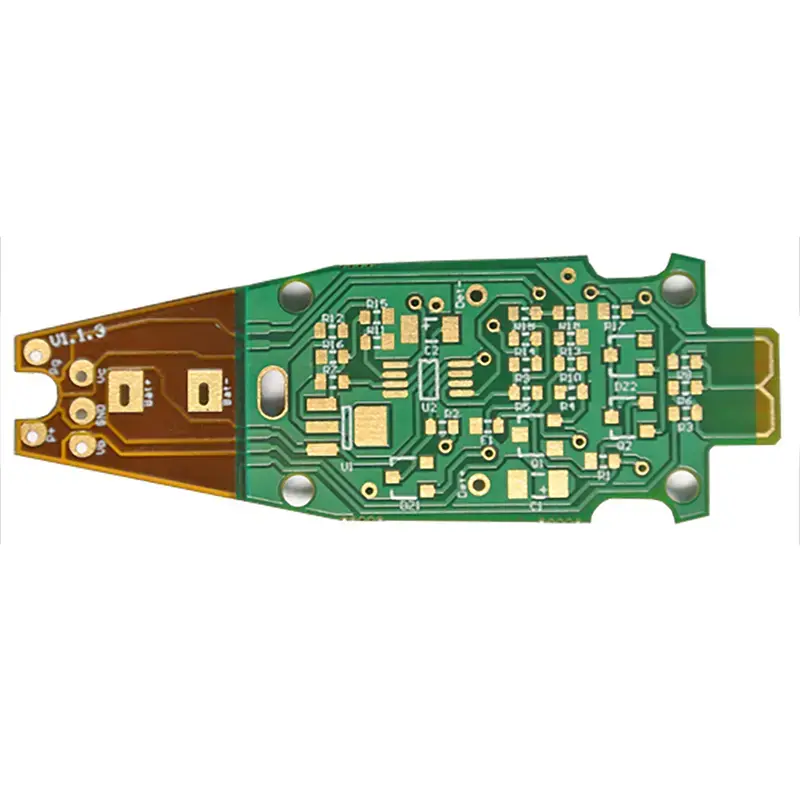 Rigid-Flex
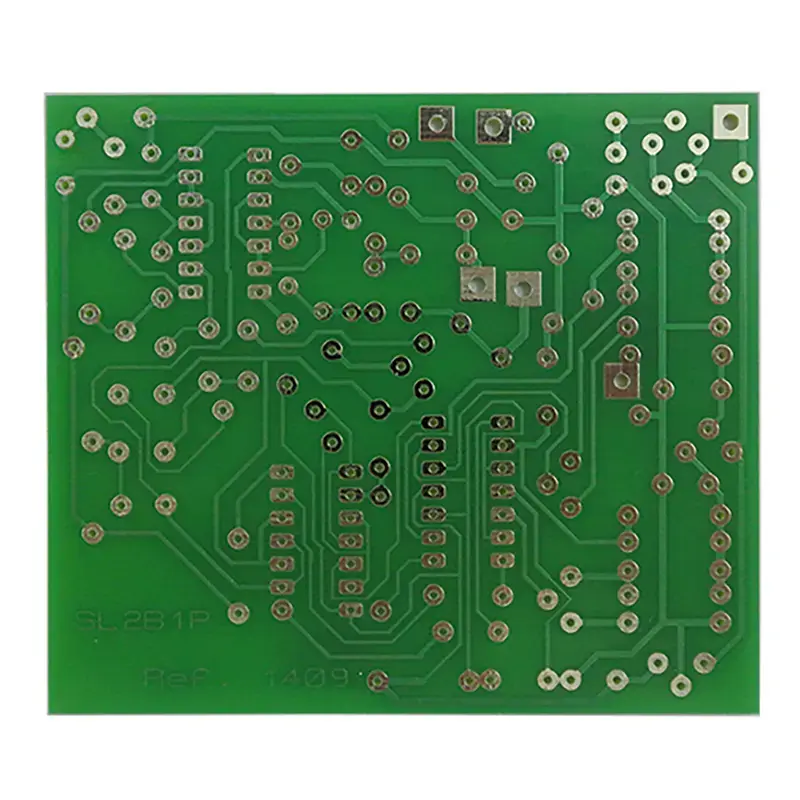 FR-4
FR-4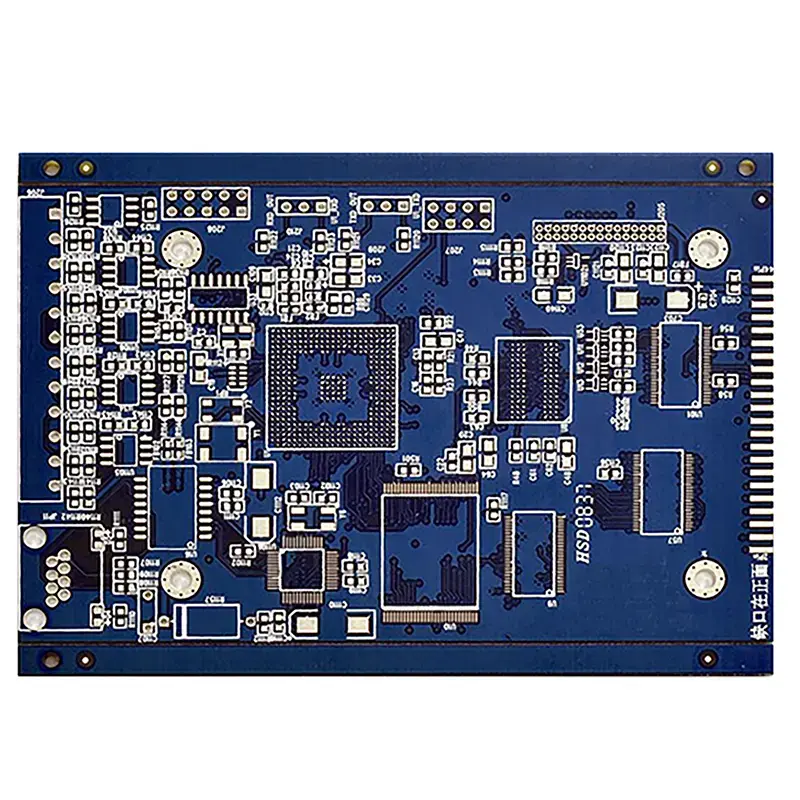 HDI PCB
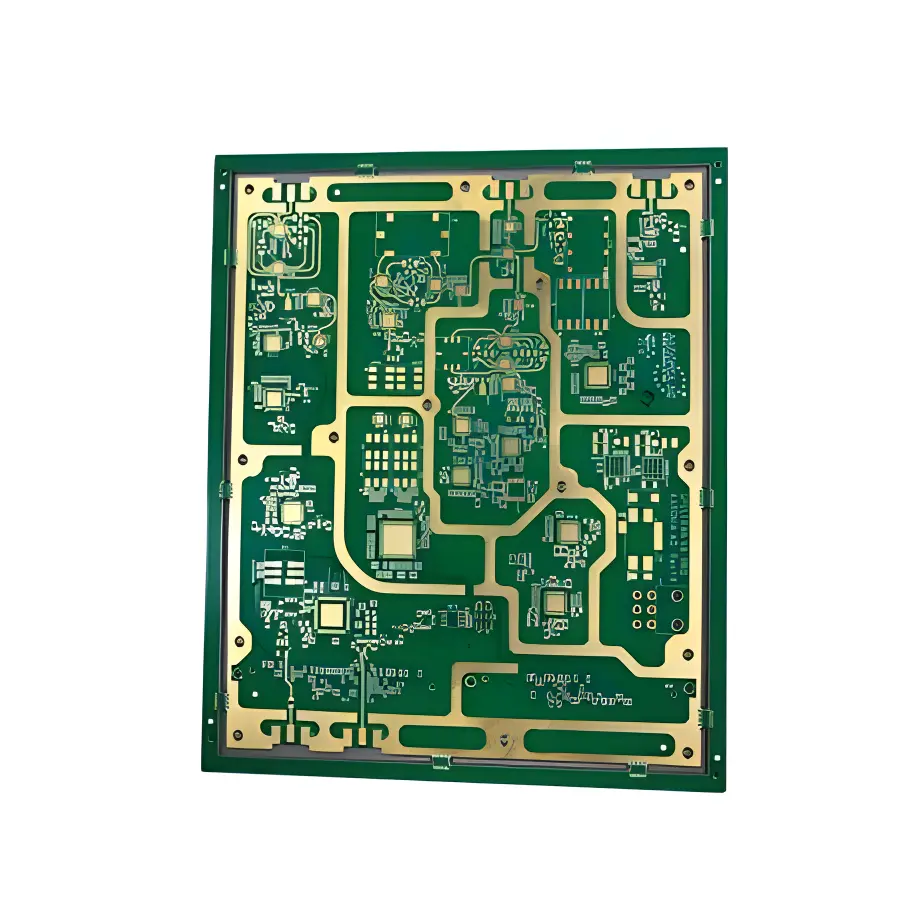 Rogers High-Frequency Board
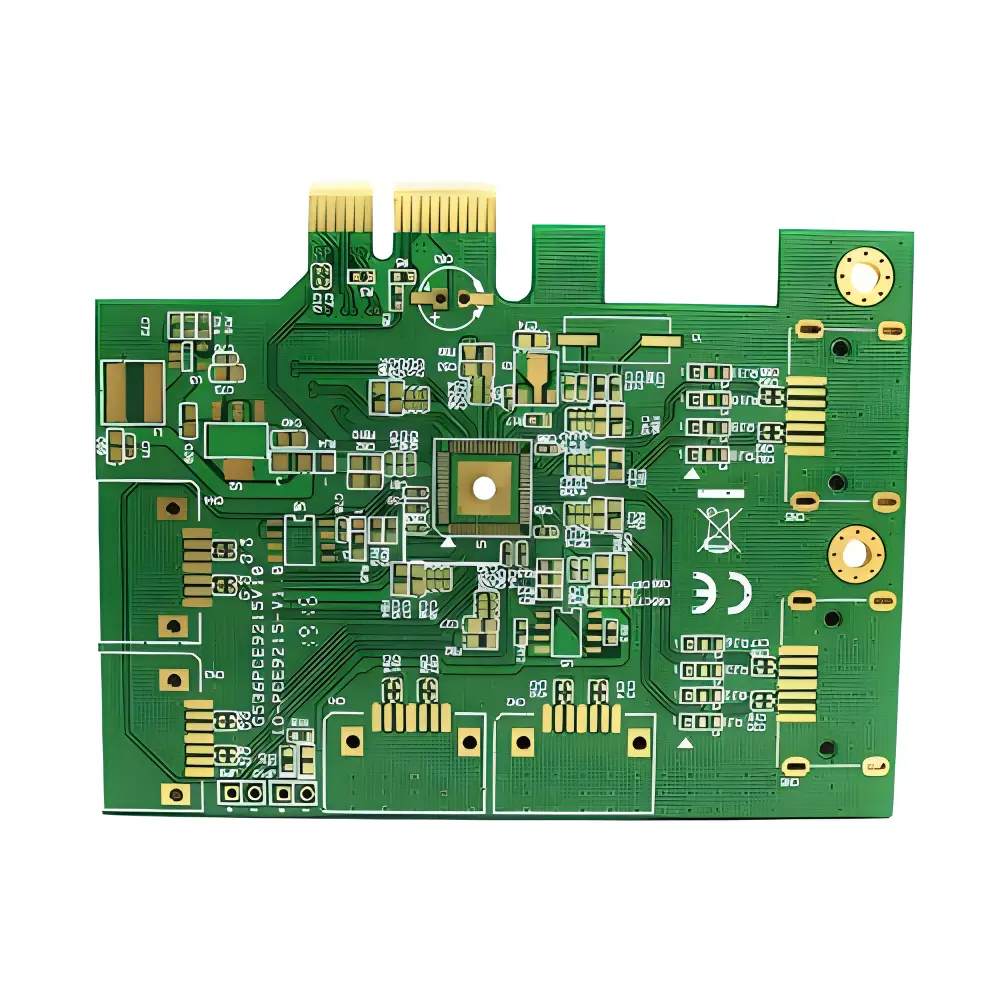 PTFE Teflon High-Frequency Board
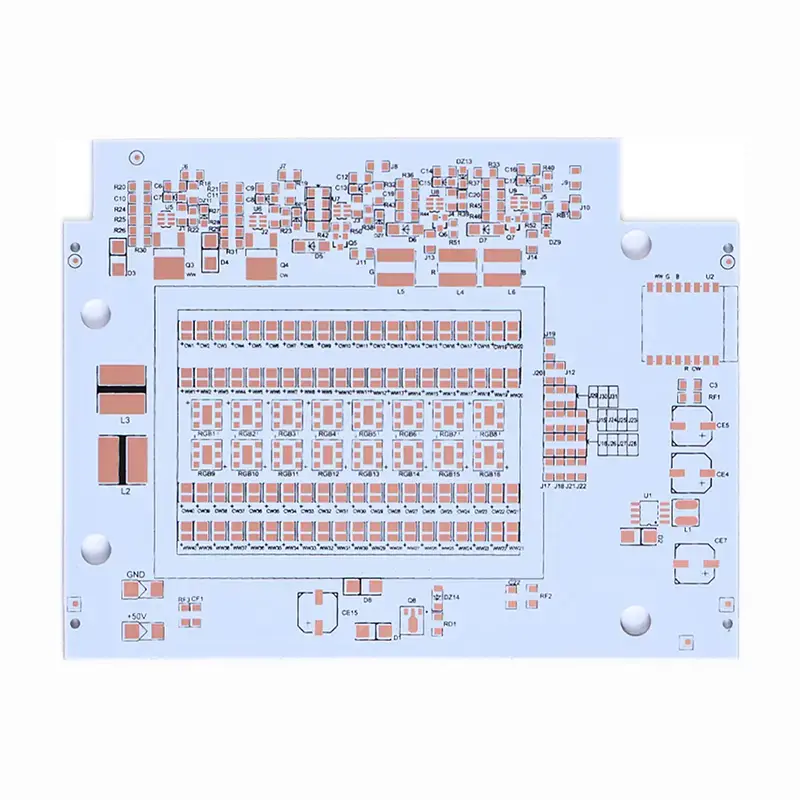 Aluminum
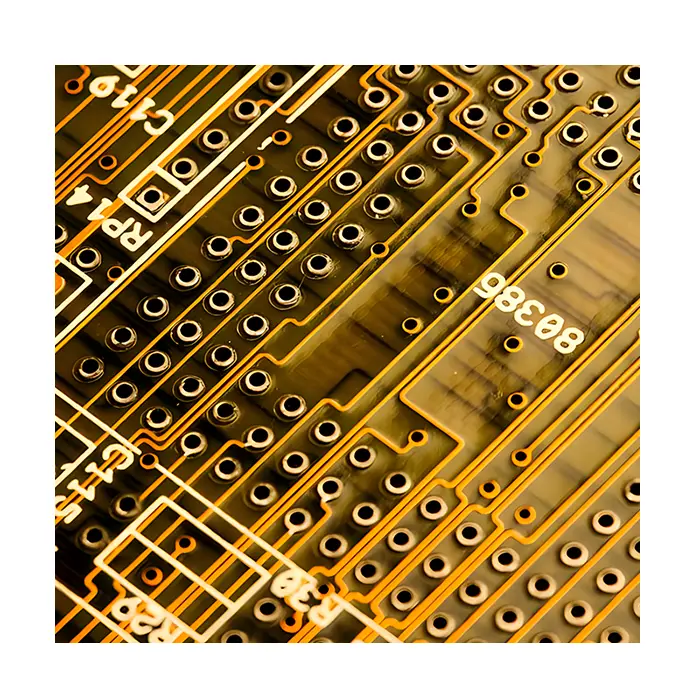 Copper Core
 PCB Assembly
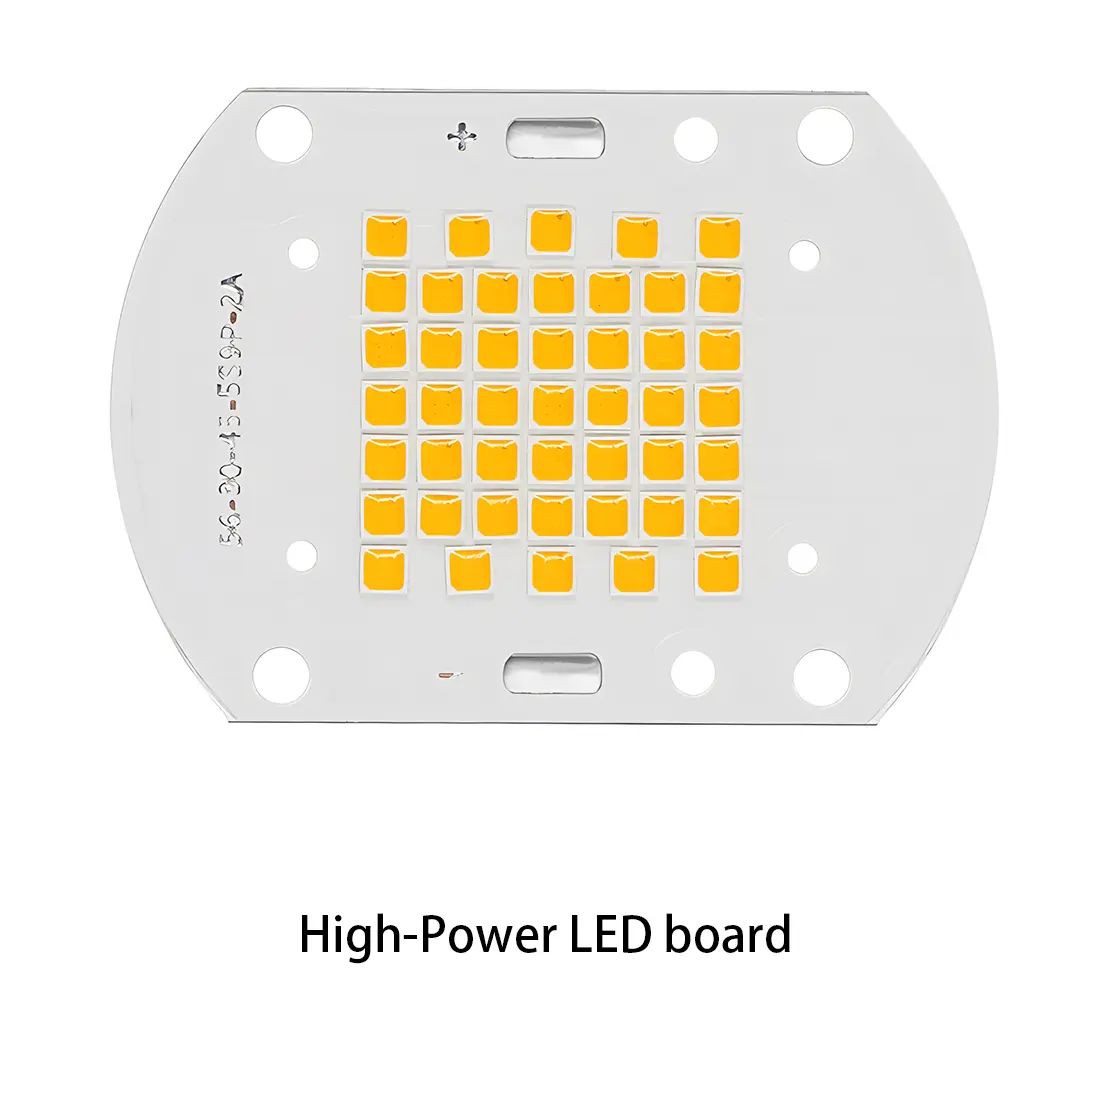 LED light PCBA
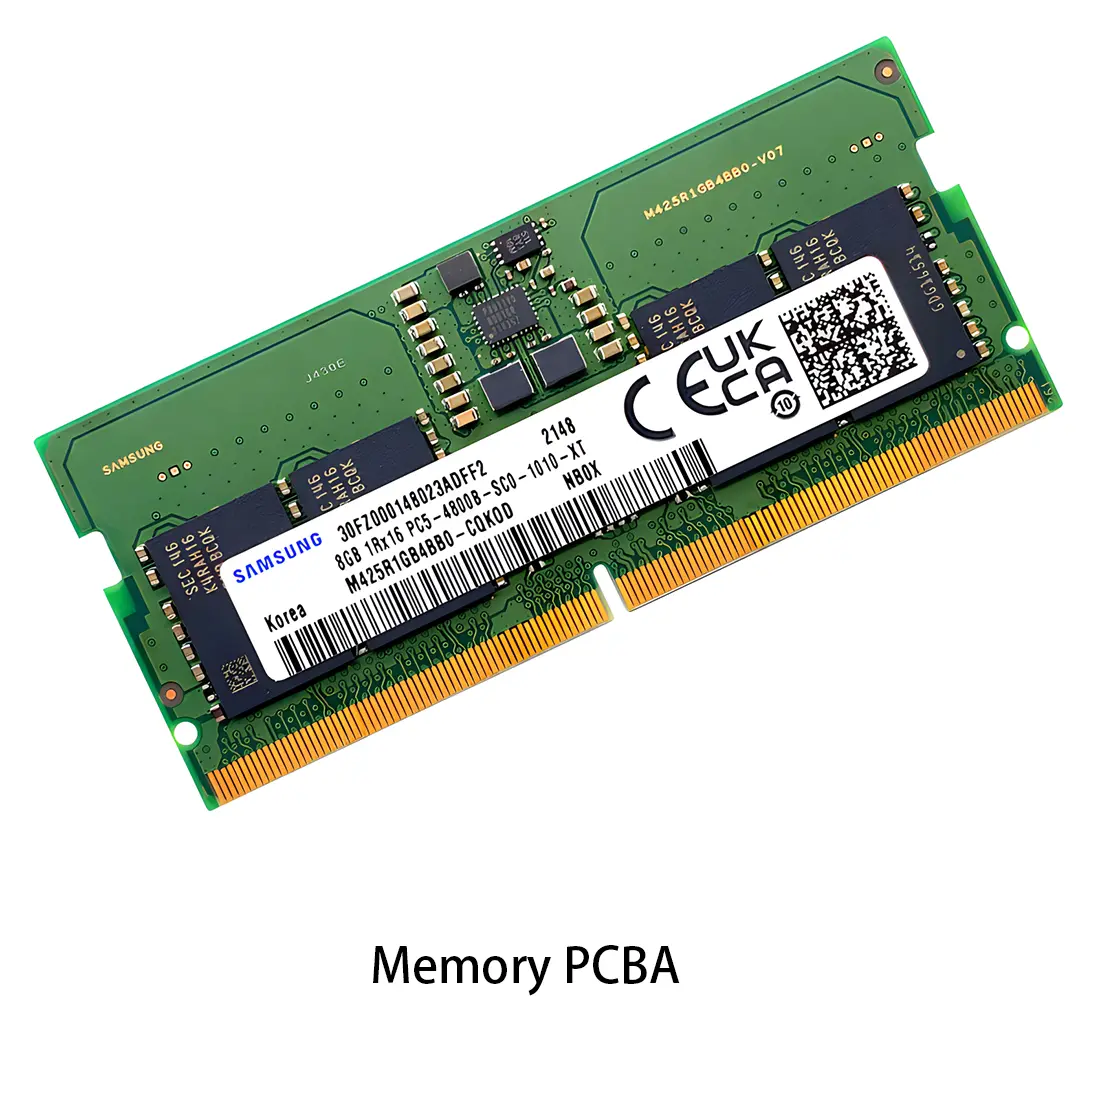 Memory PCBA
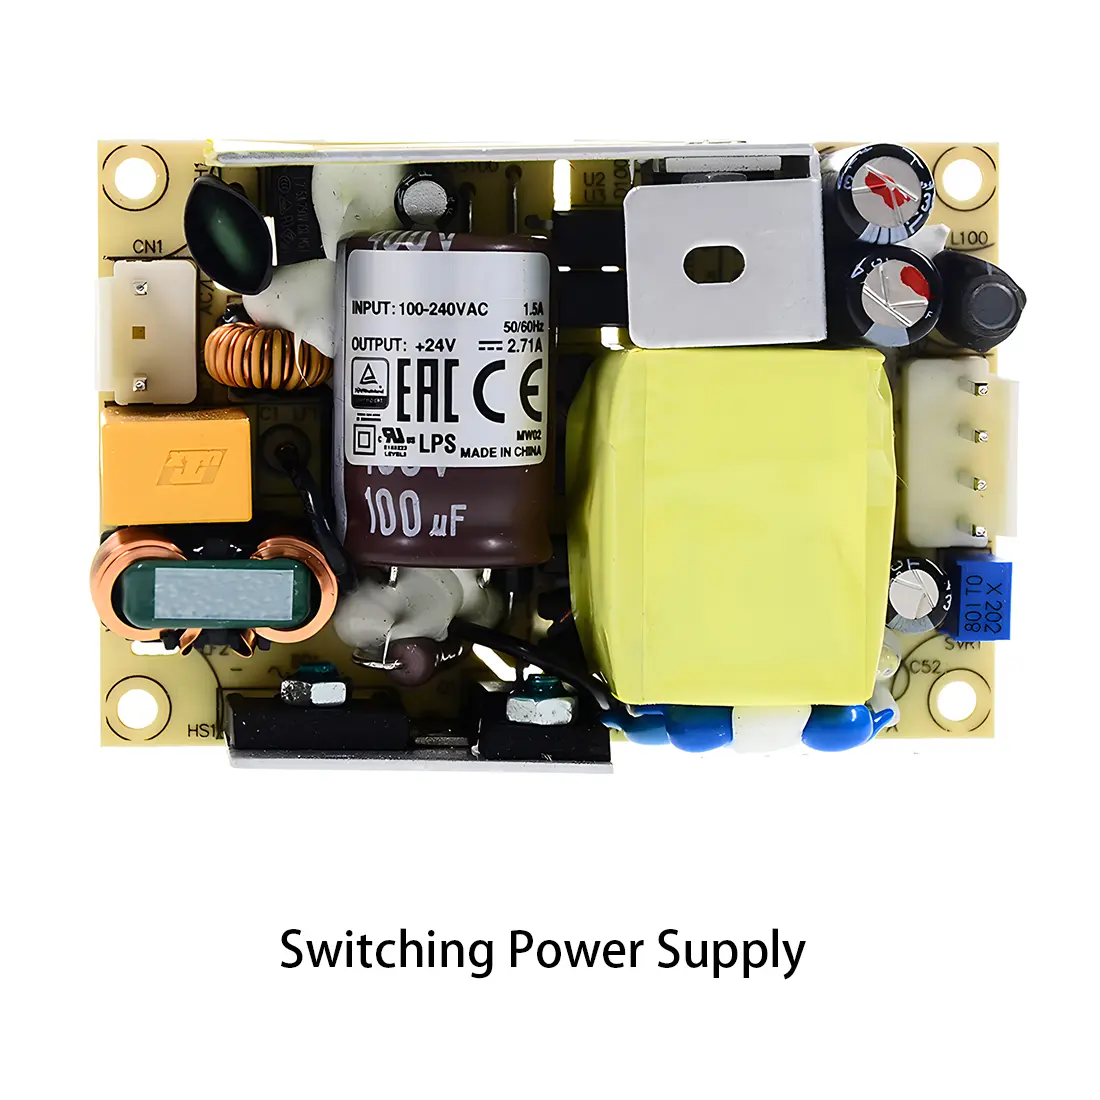 Power Supply PCBA
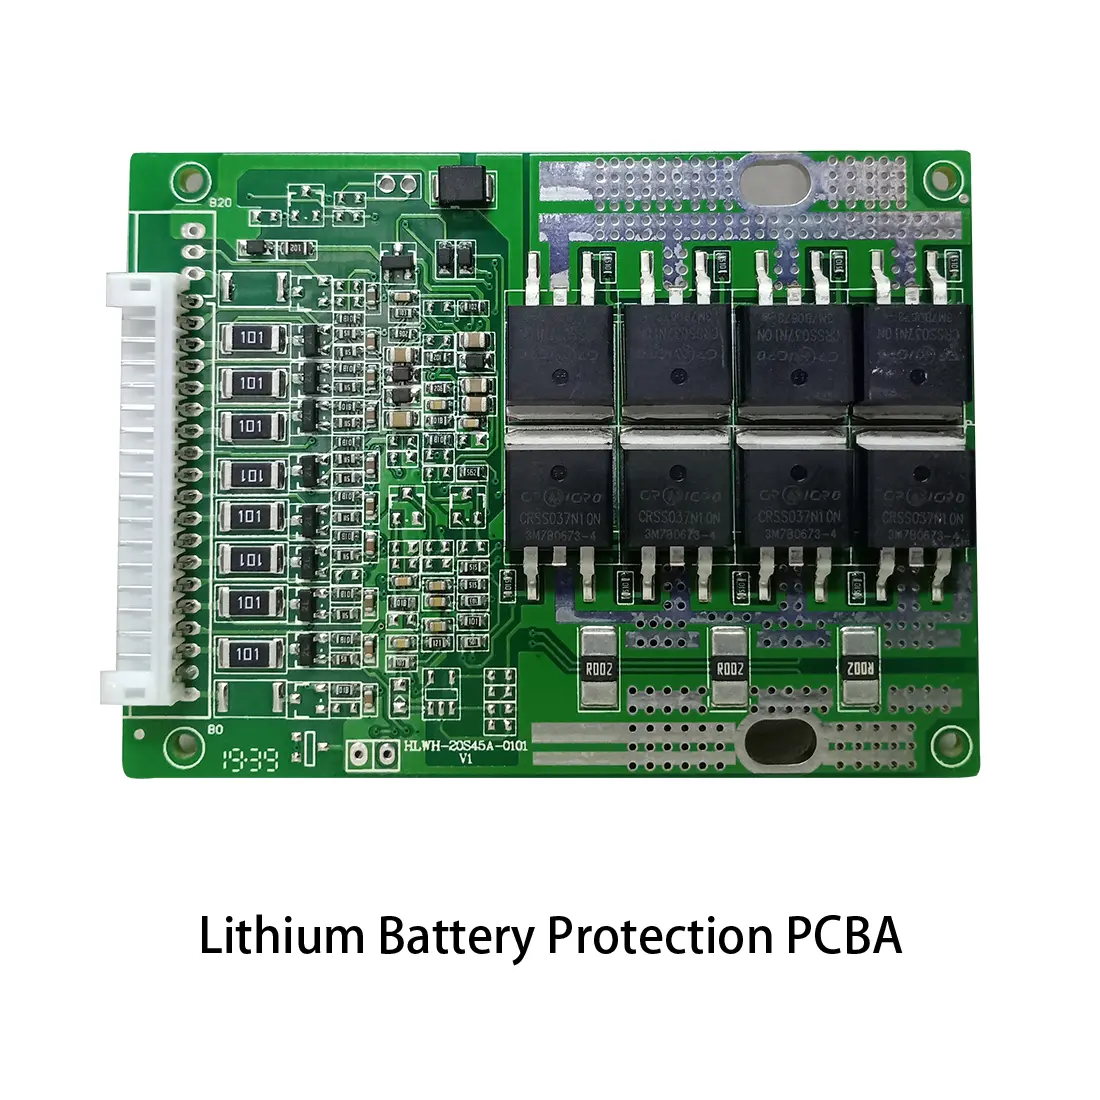 New Energey PCBA
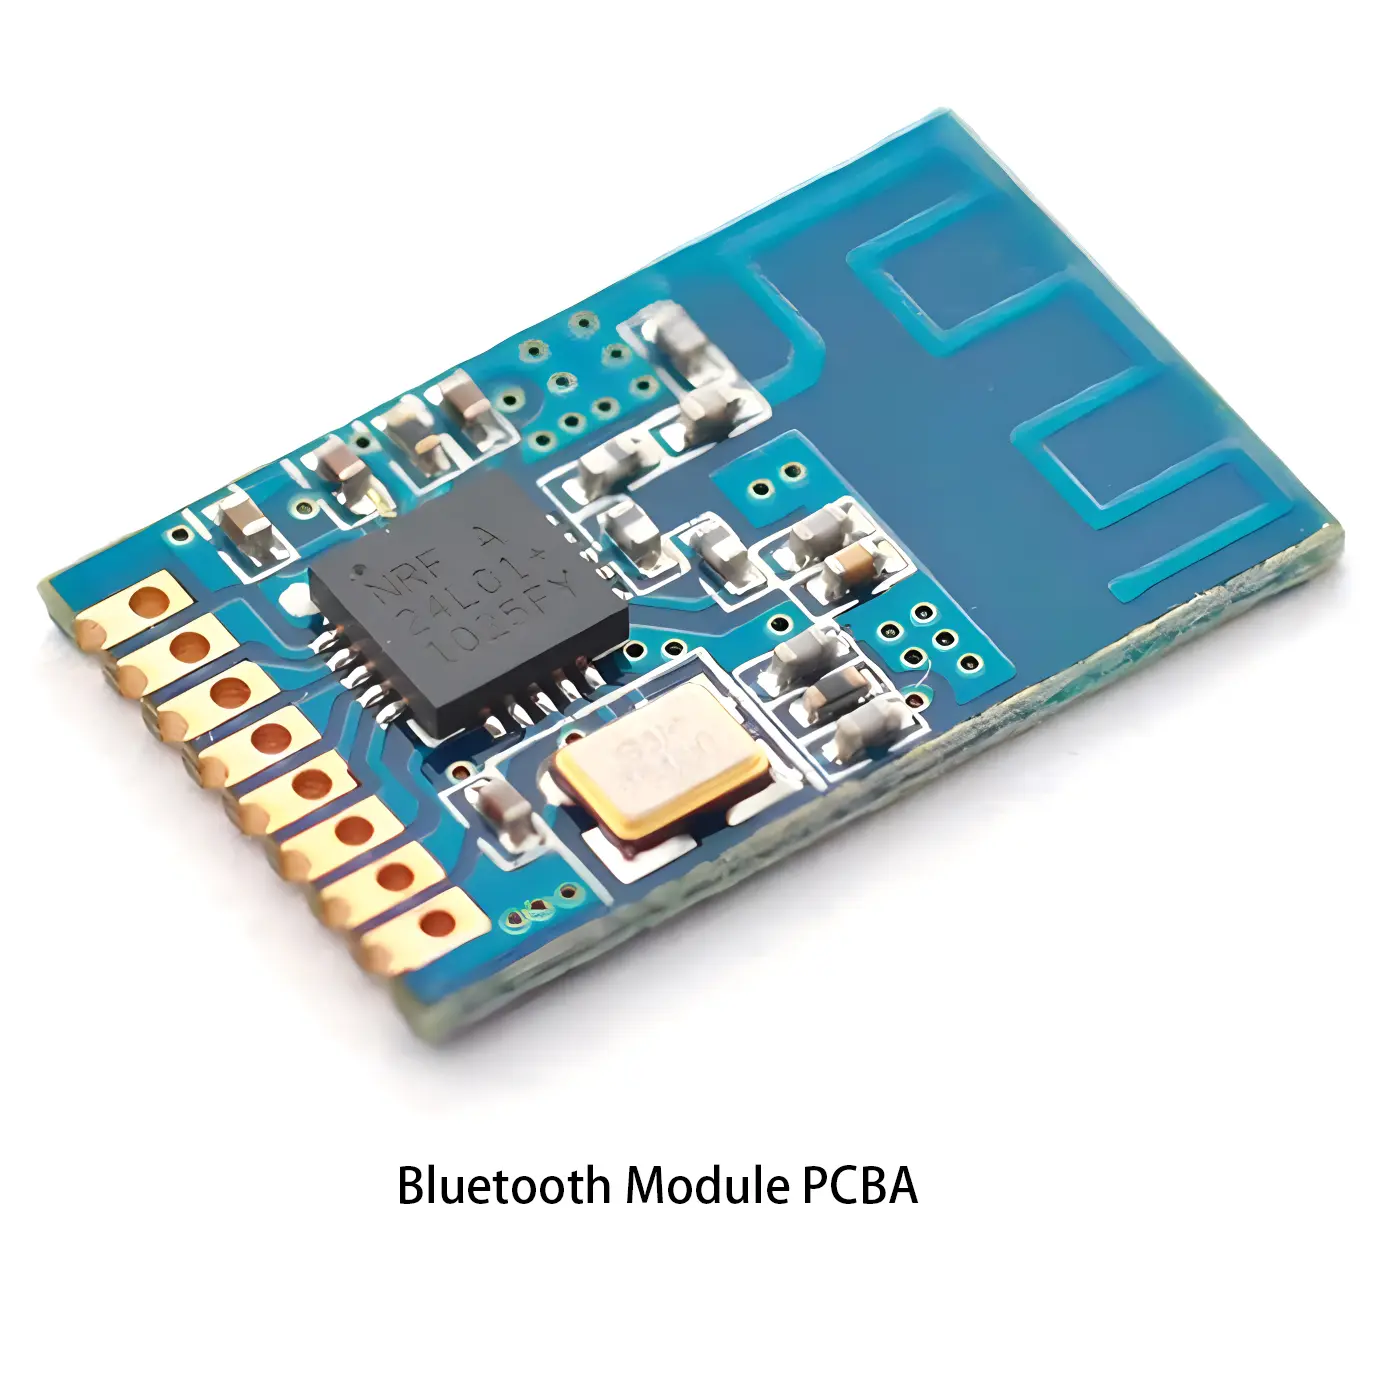 Communication PCBA
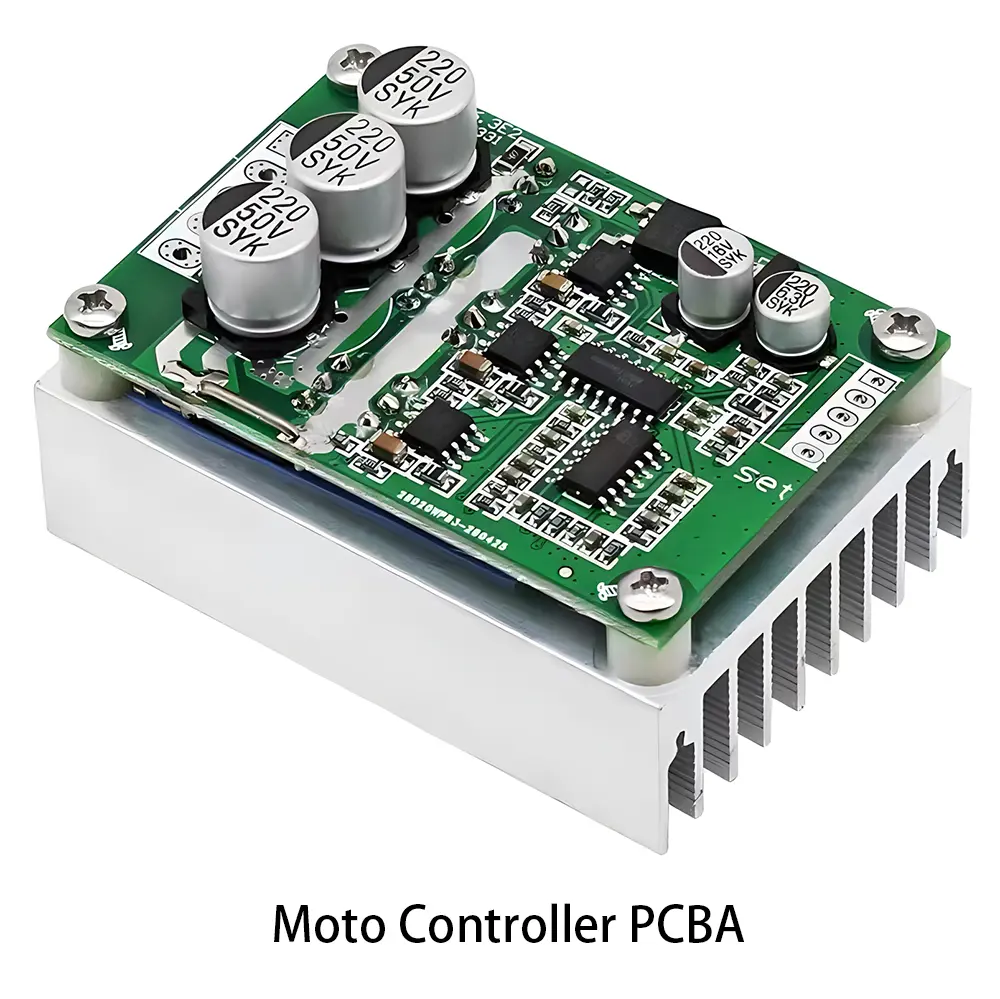 Industrial Control PCBA
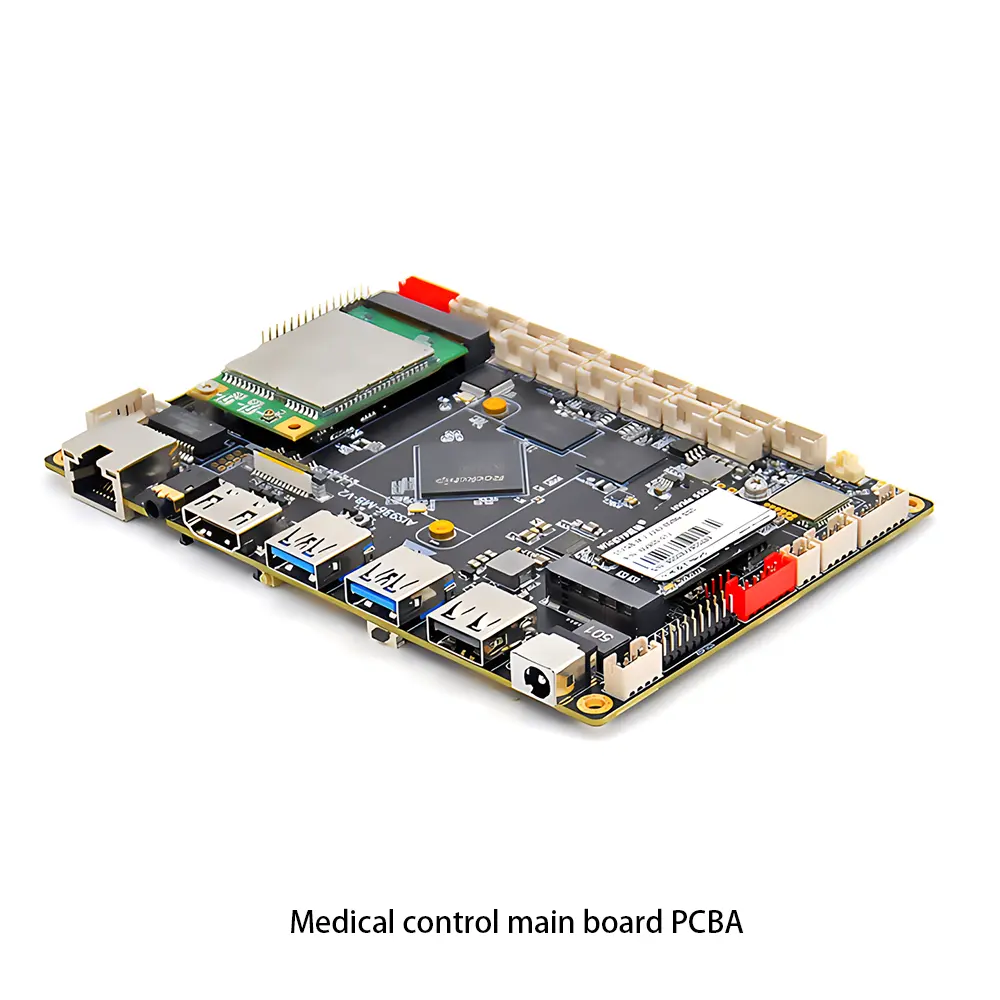 Medical Equipment PCBA
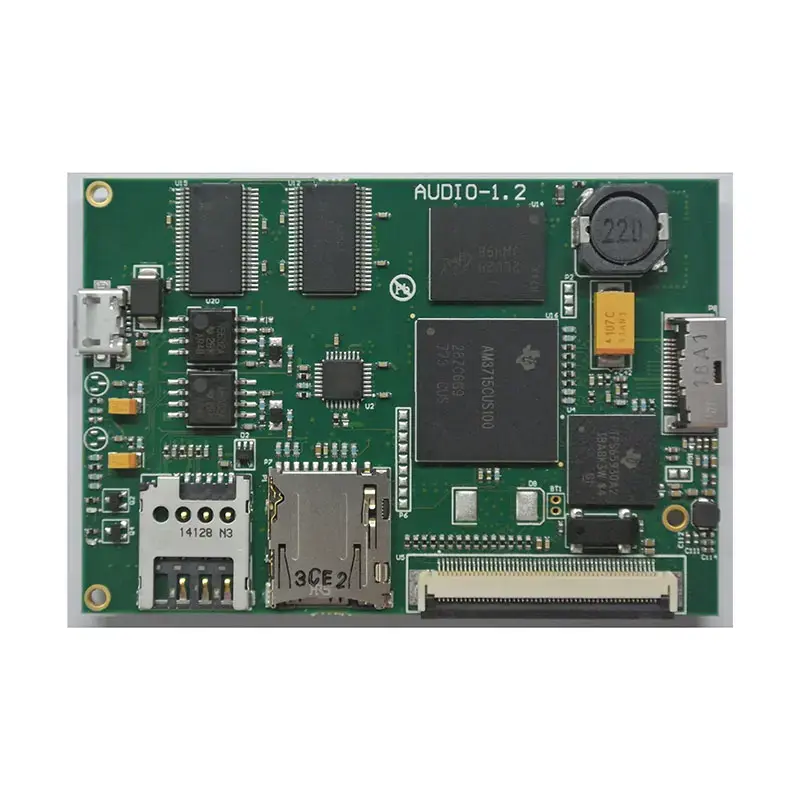 Testing Service
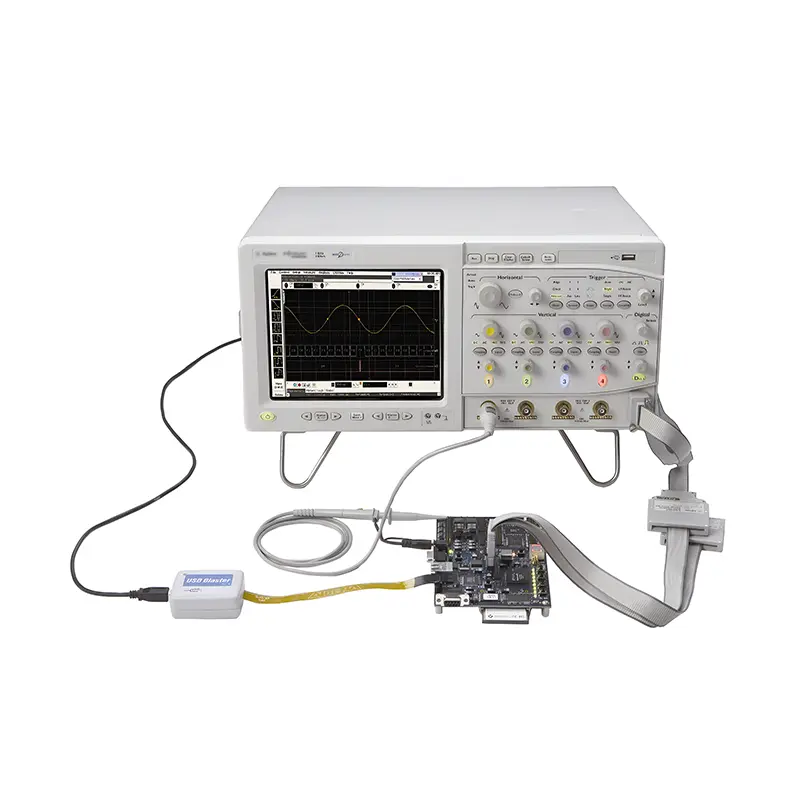 PCBA Testing Service
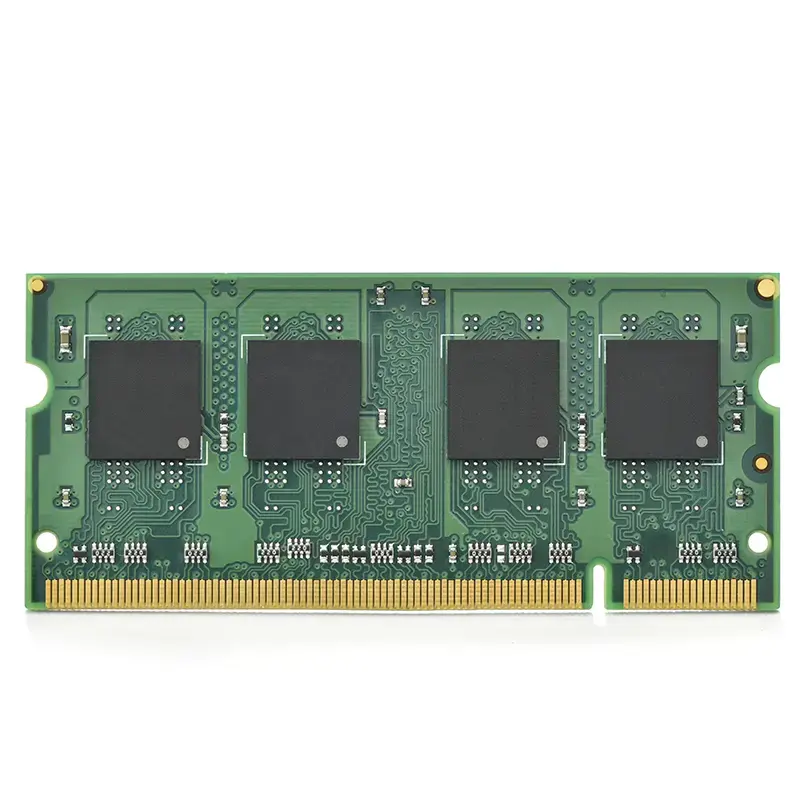 Certification Application
 RoHS Certification Application
 REACH Certification Application
 CE Certification Application
 FCC Certification Application
 CQC Certification Application
 UL Certification Application
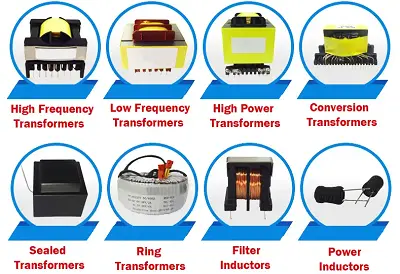 Transformers, Inductors
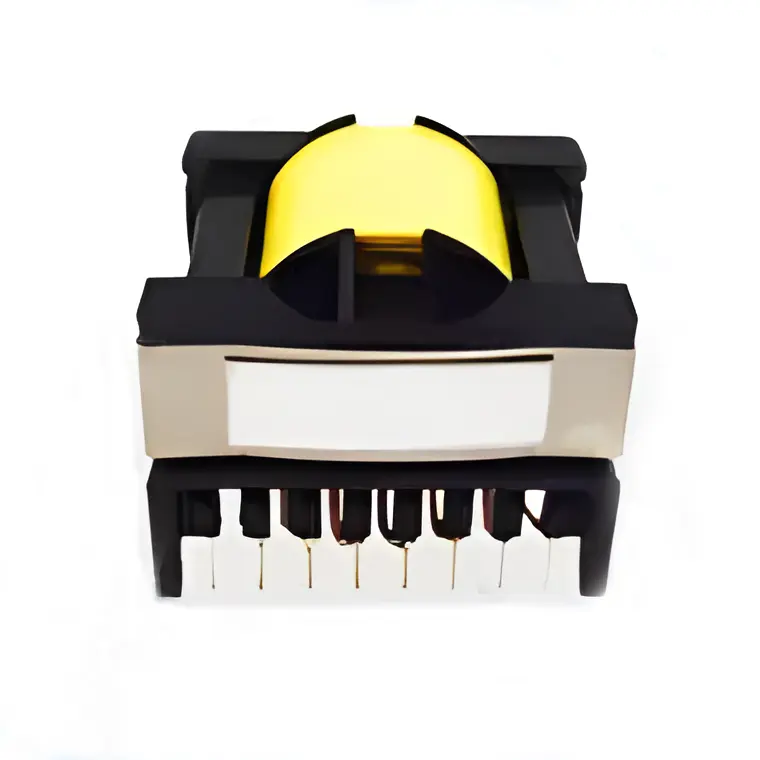 High Frequency Transformers
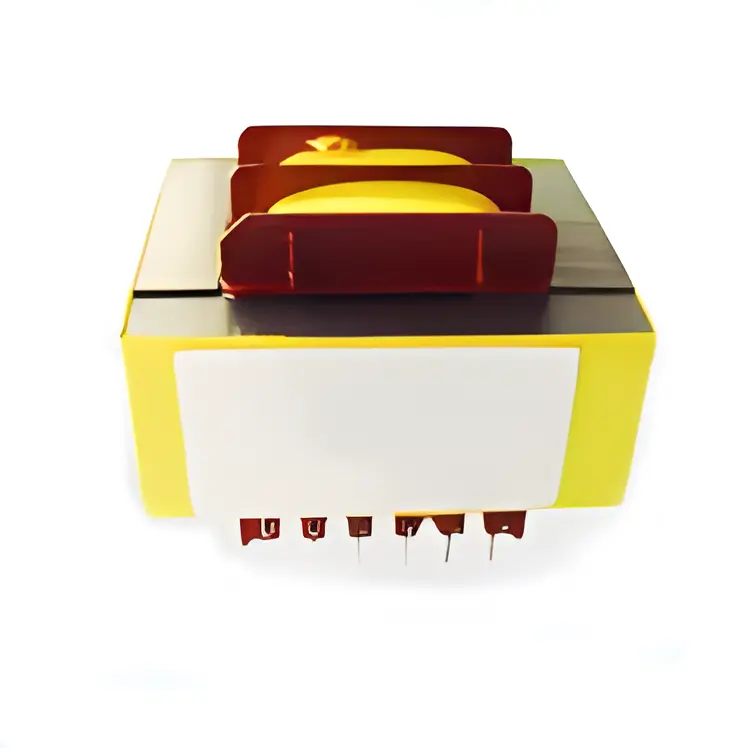 Low Frequency Transformers
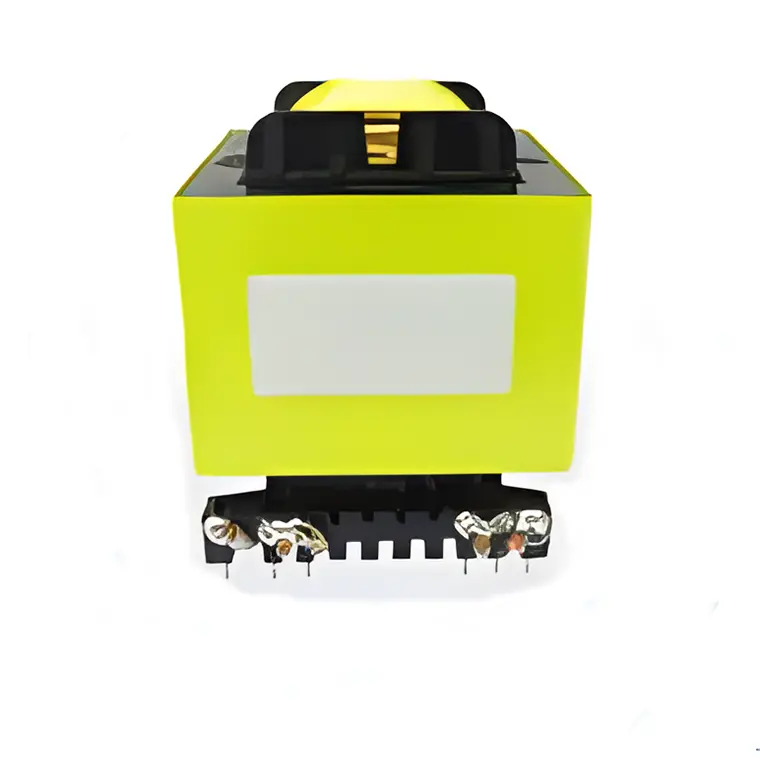 High Power Transformers
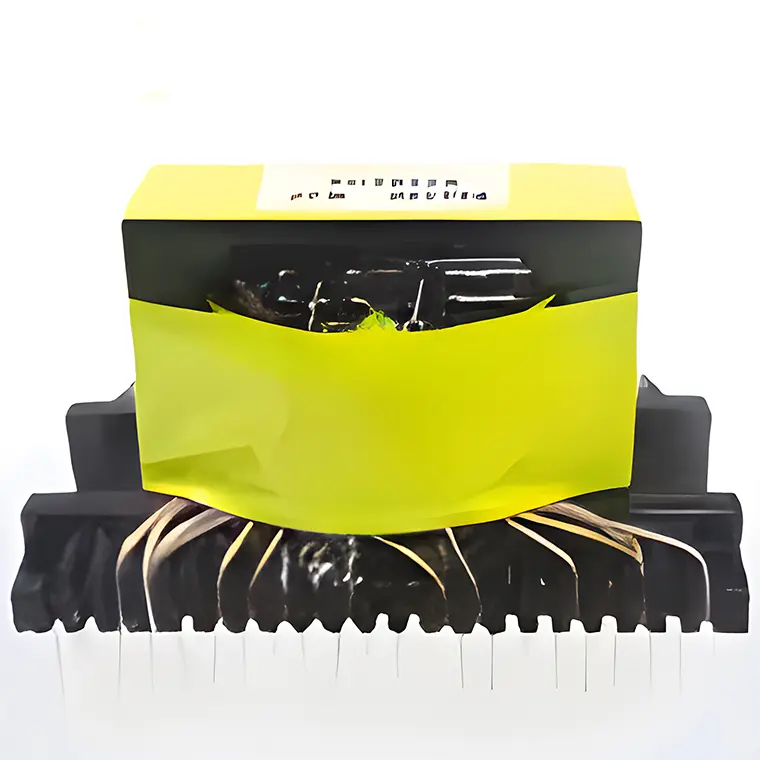 Conversion Transformers
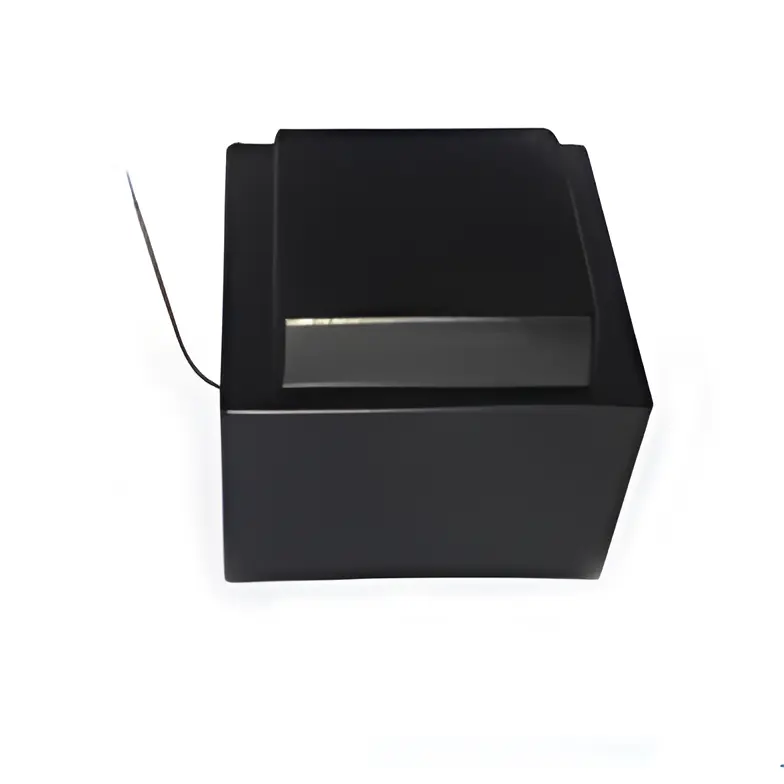 Sealed Transformers
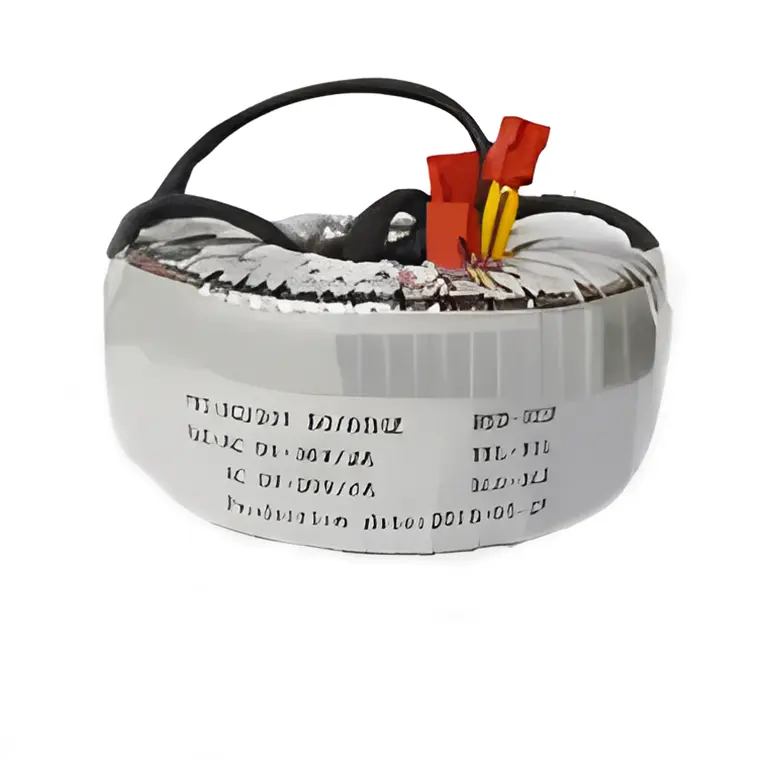 Ring Transformers
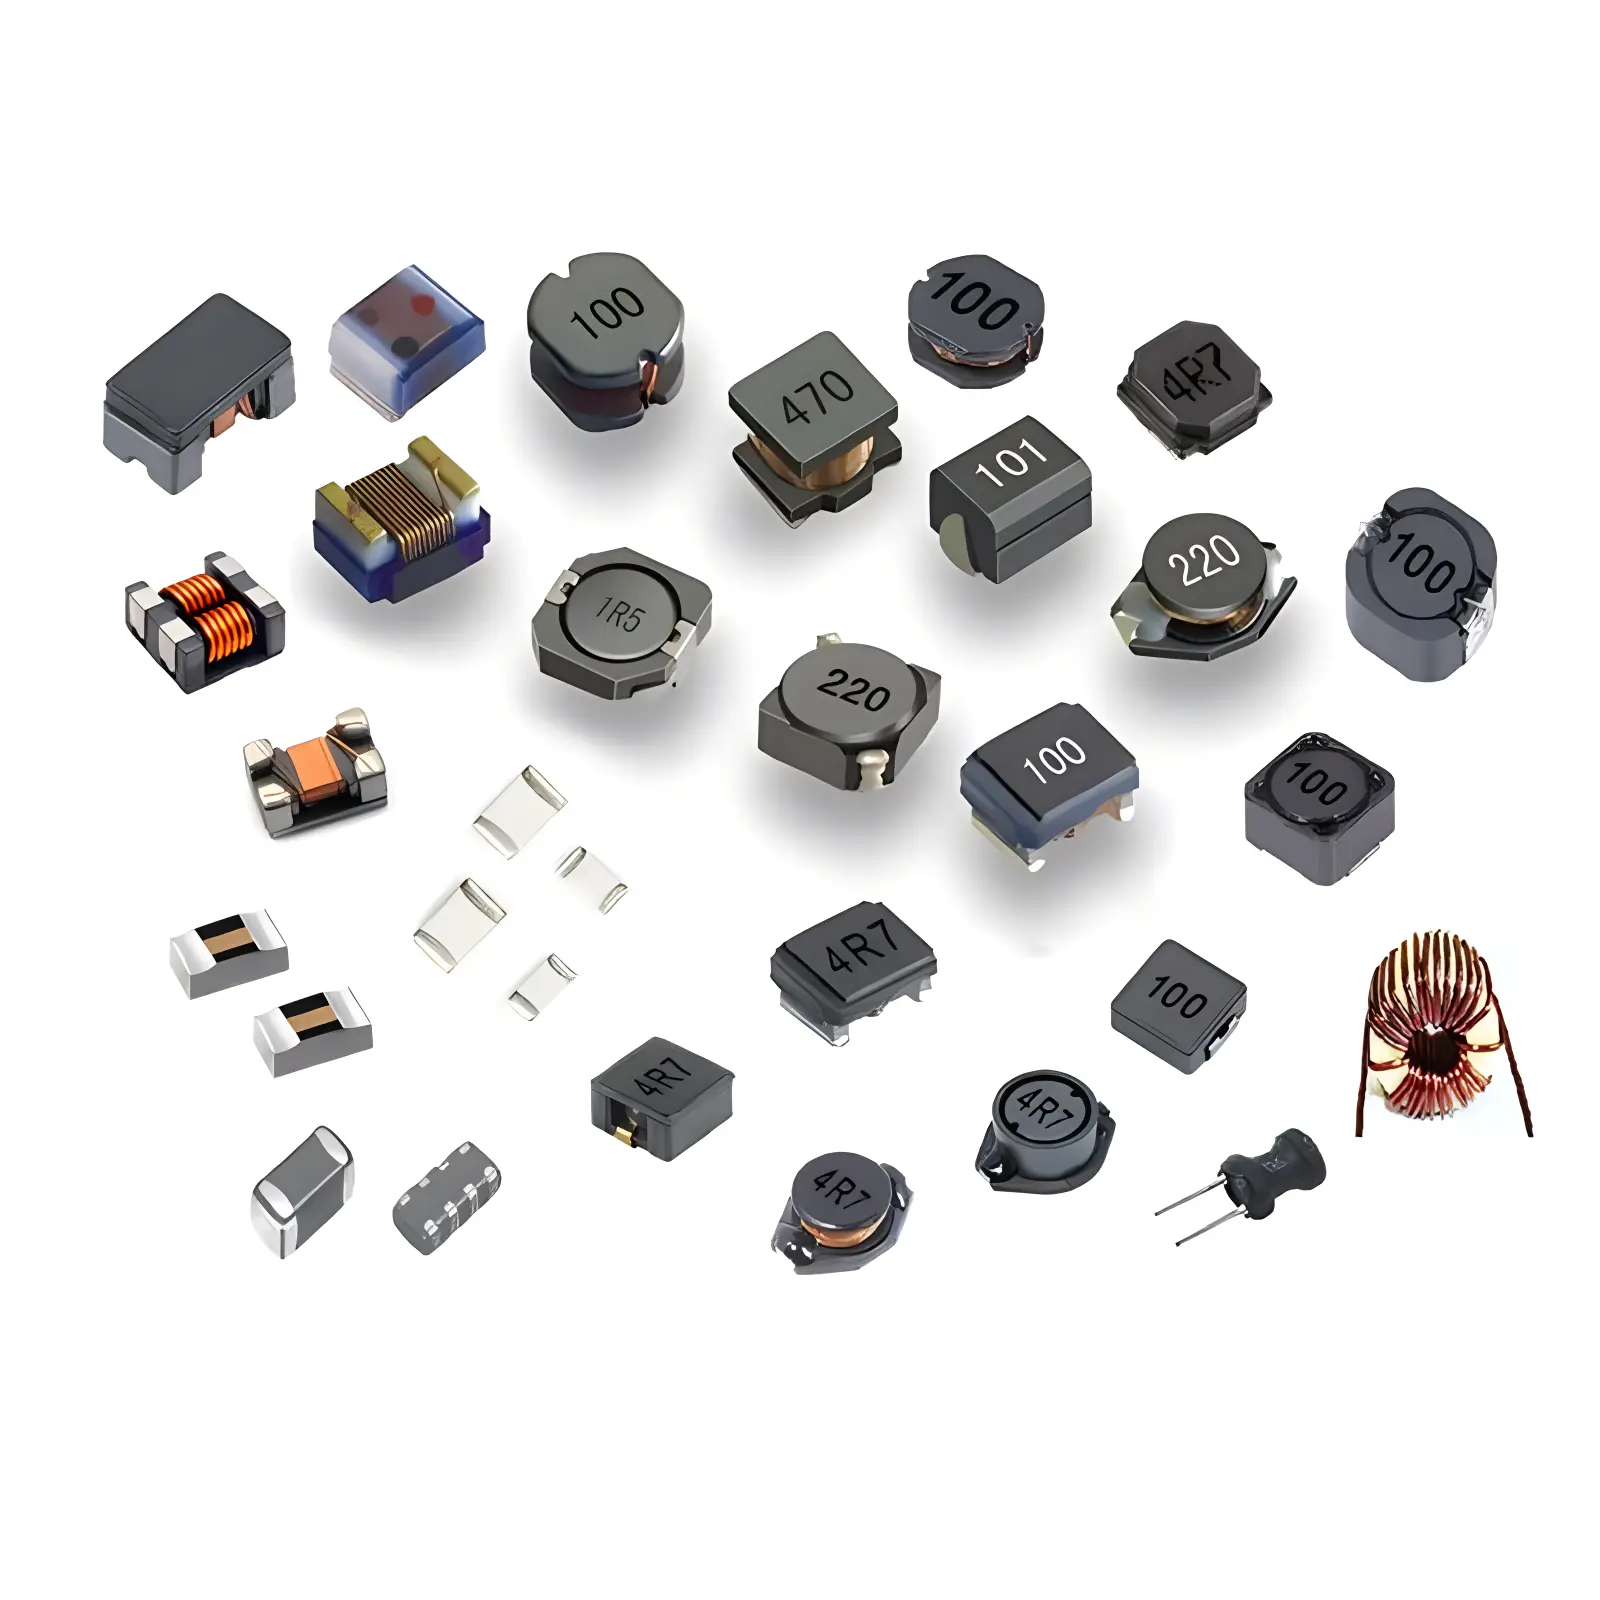 Inductors
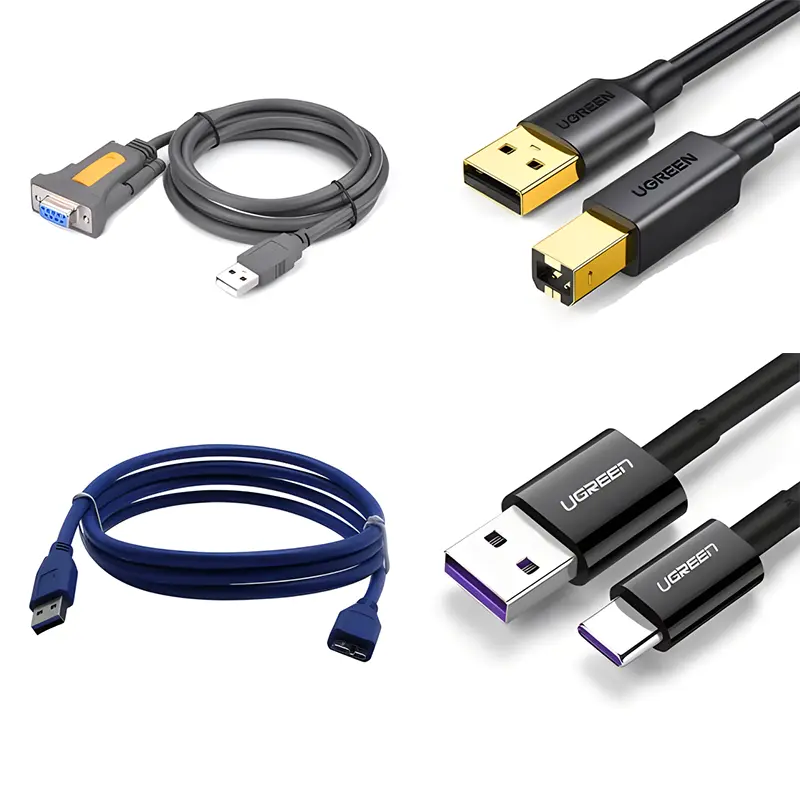 Wires,Cables Customized
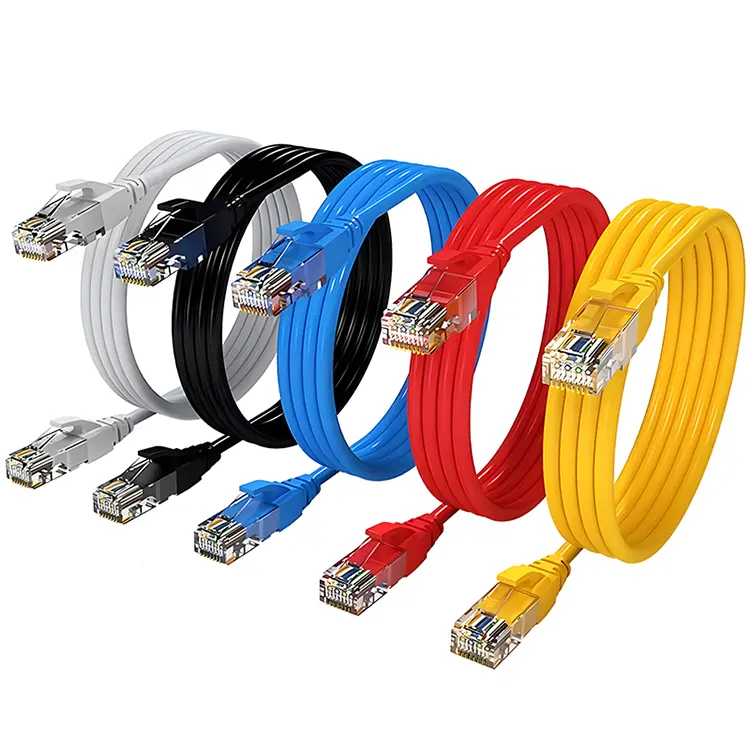 Network Cables
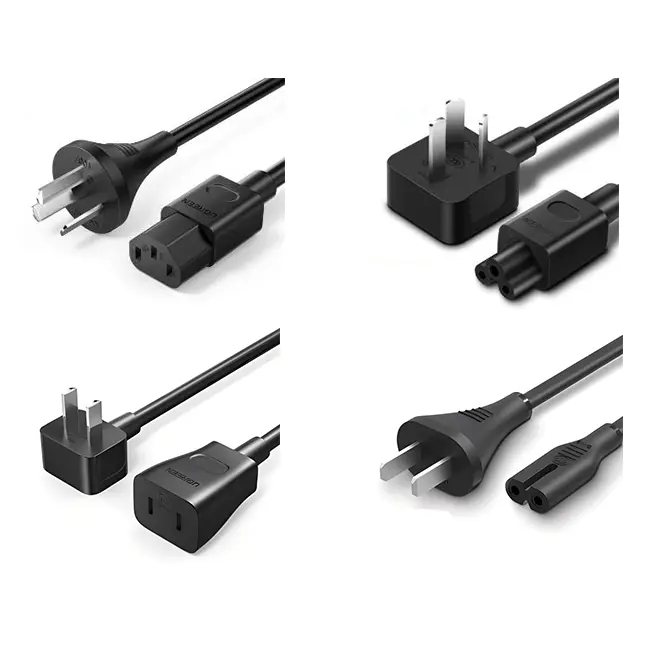 Power Cords
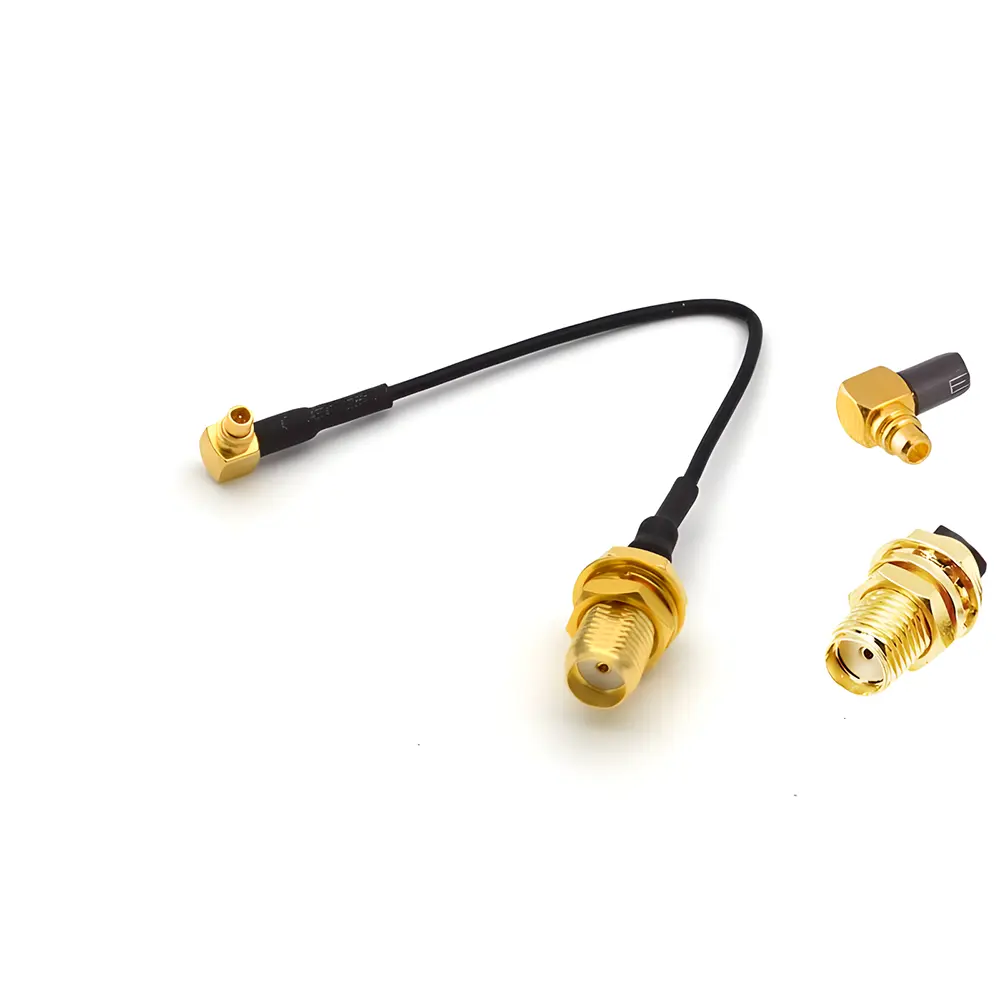 Antenna Cables
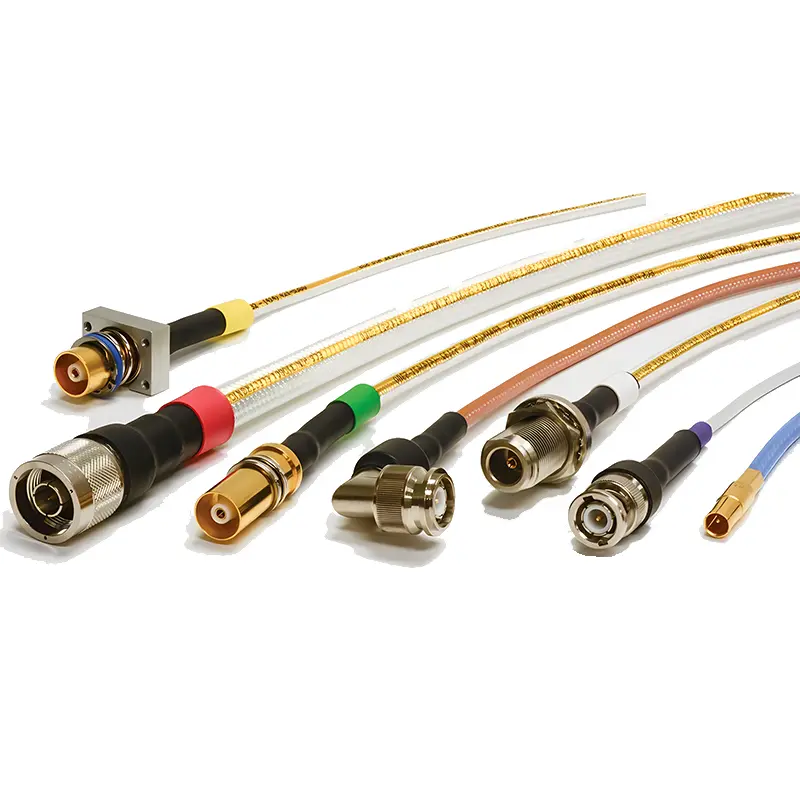 Coaxial Cables
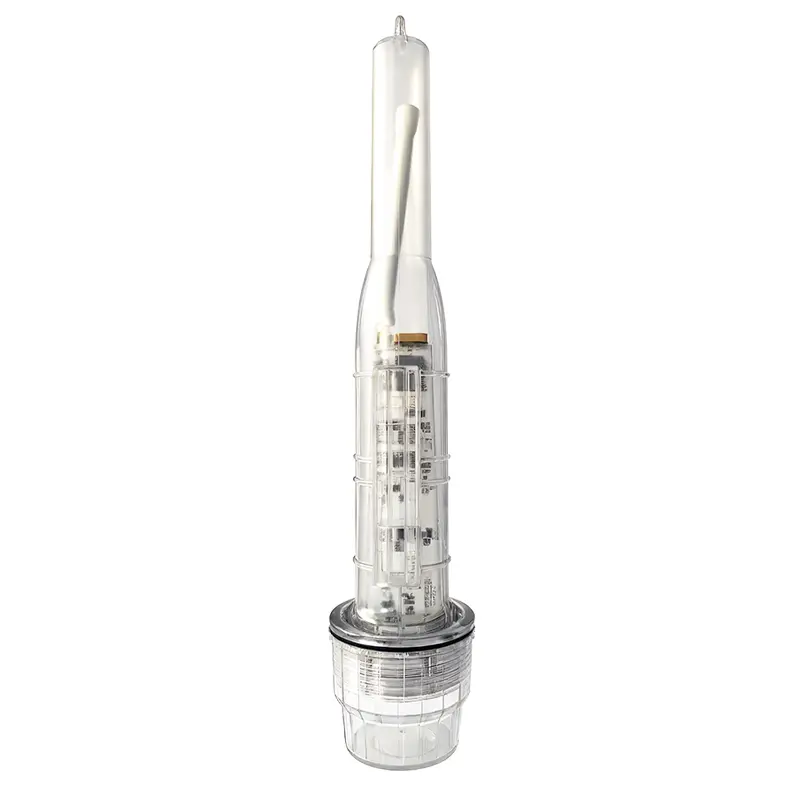 Net Position Indicator
 Solar AIS net position indicator
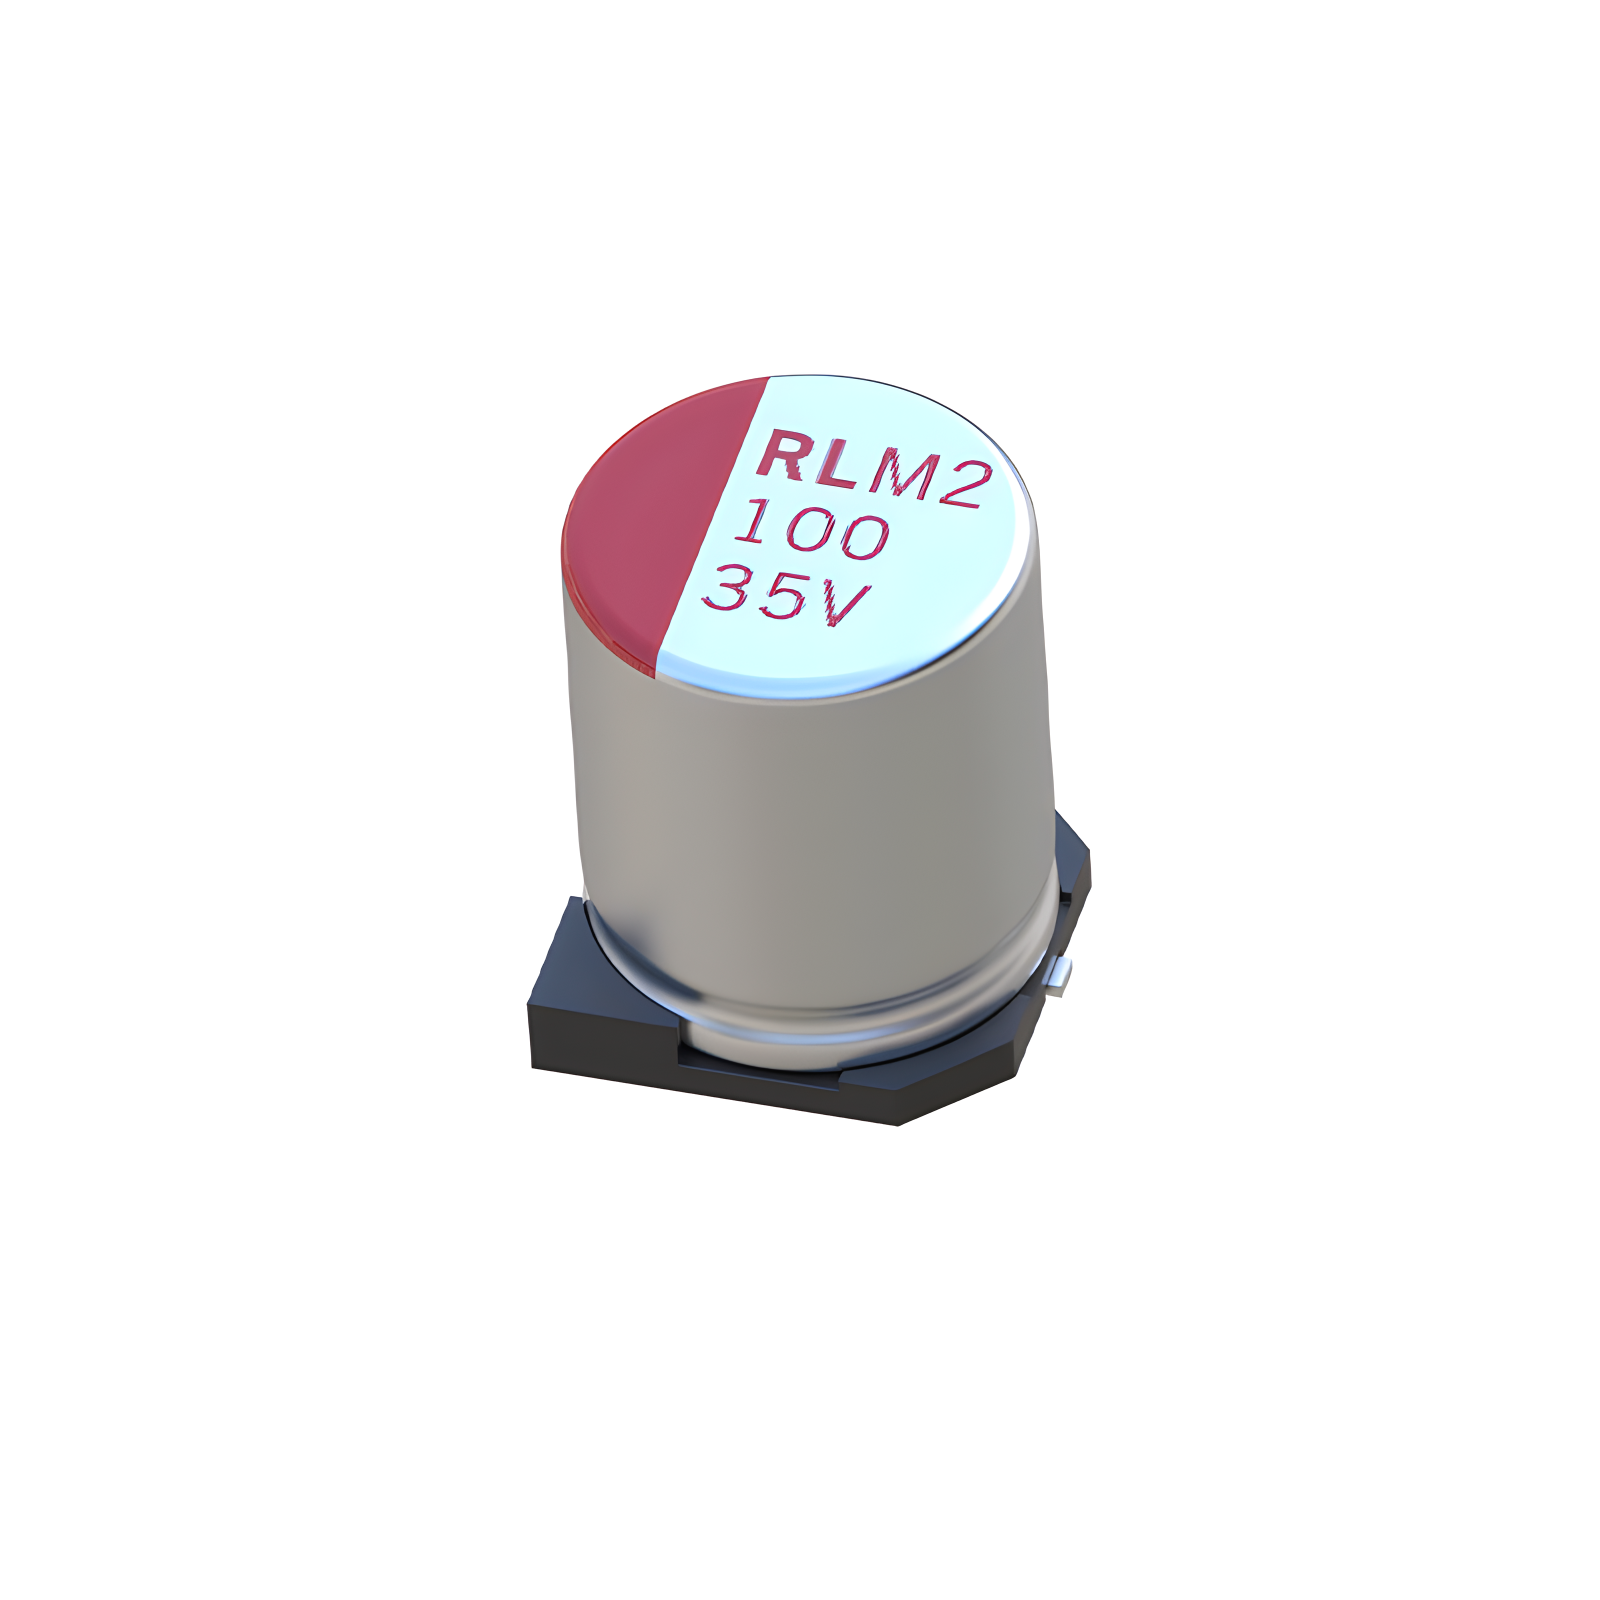 Capacitors
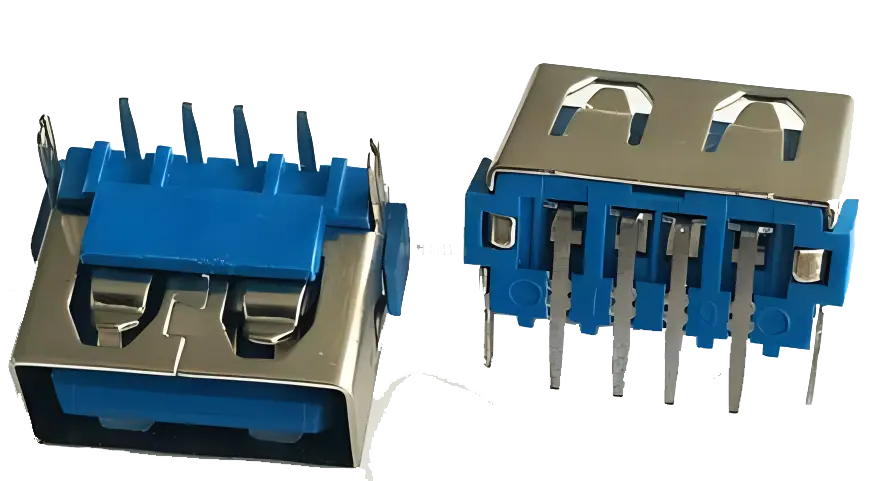 Connectors
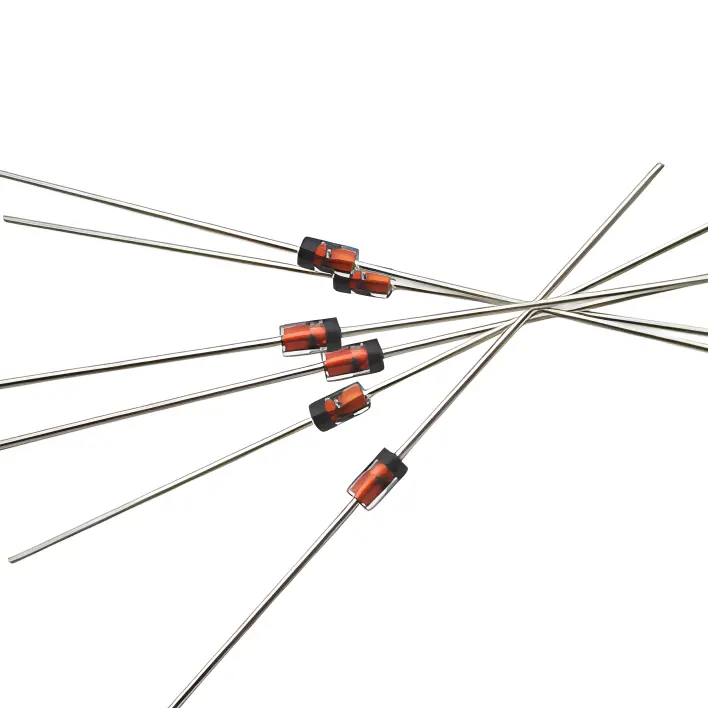 Diodes
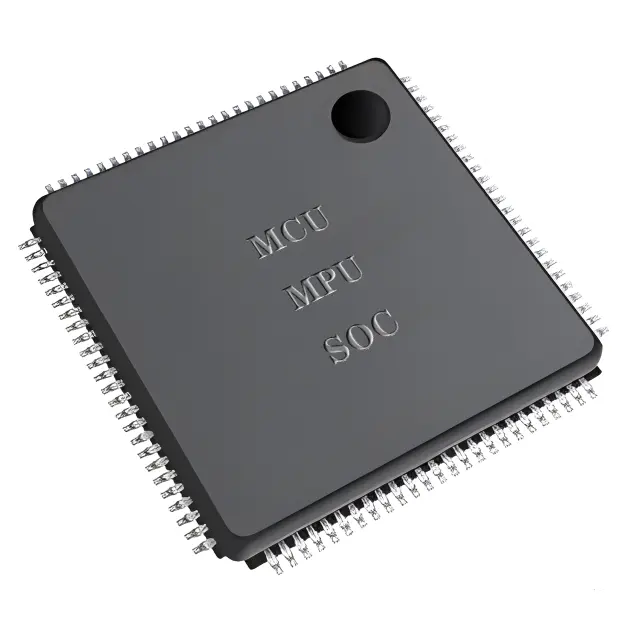 Embedded Processors & Controllers
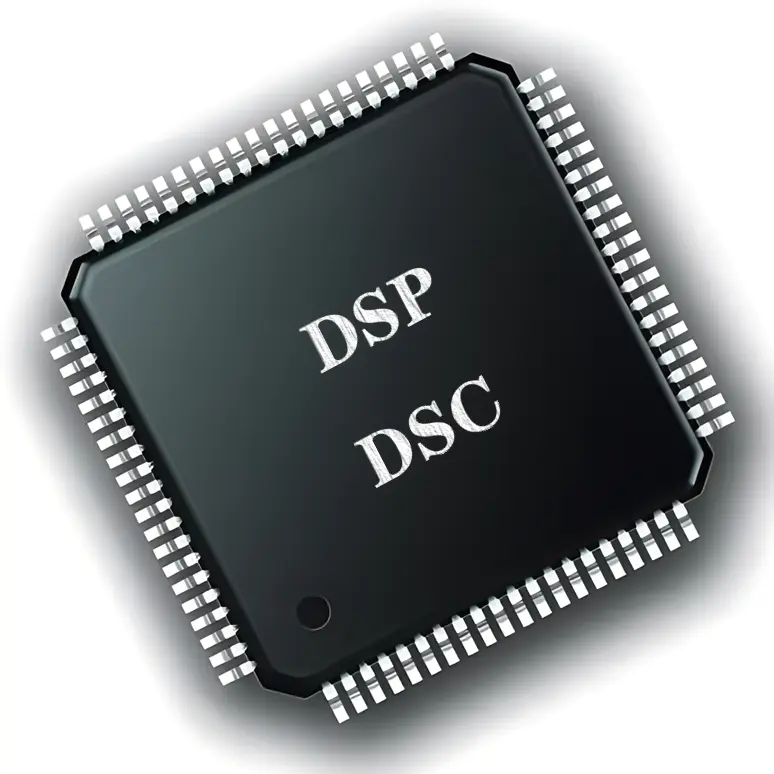 Digital Signal Processors (DSP/DSC)
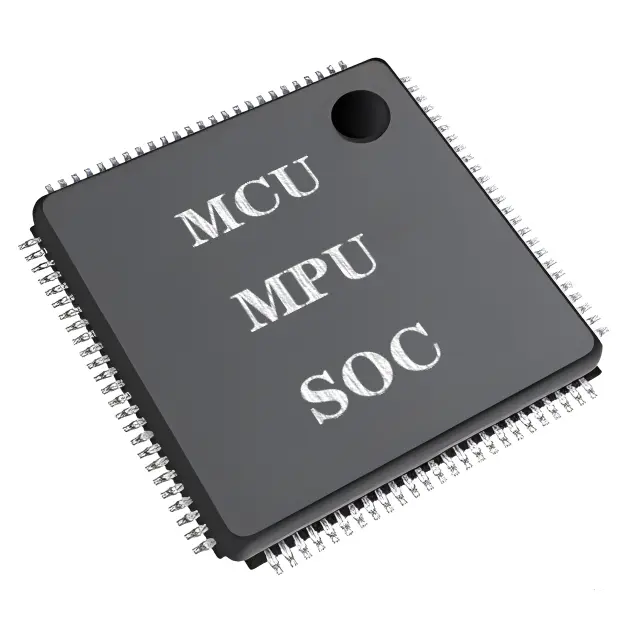 Microcontrollers (MCU/MPU/SOC)
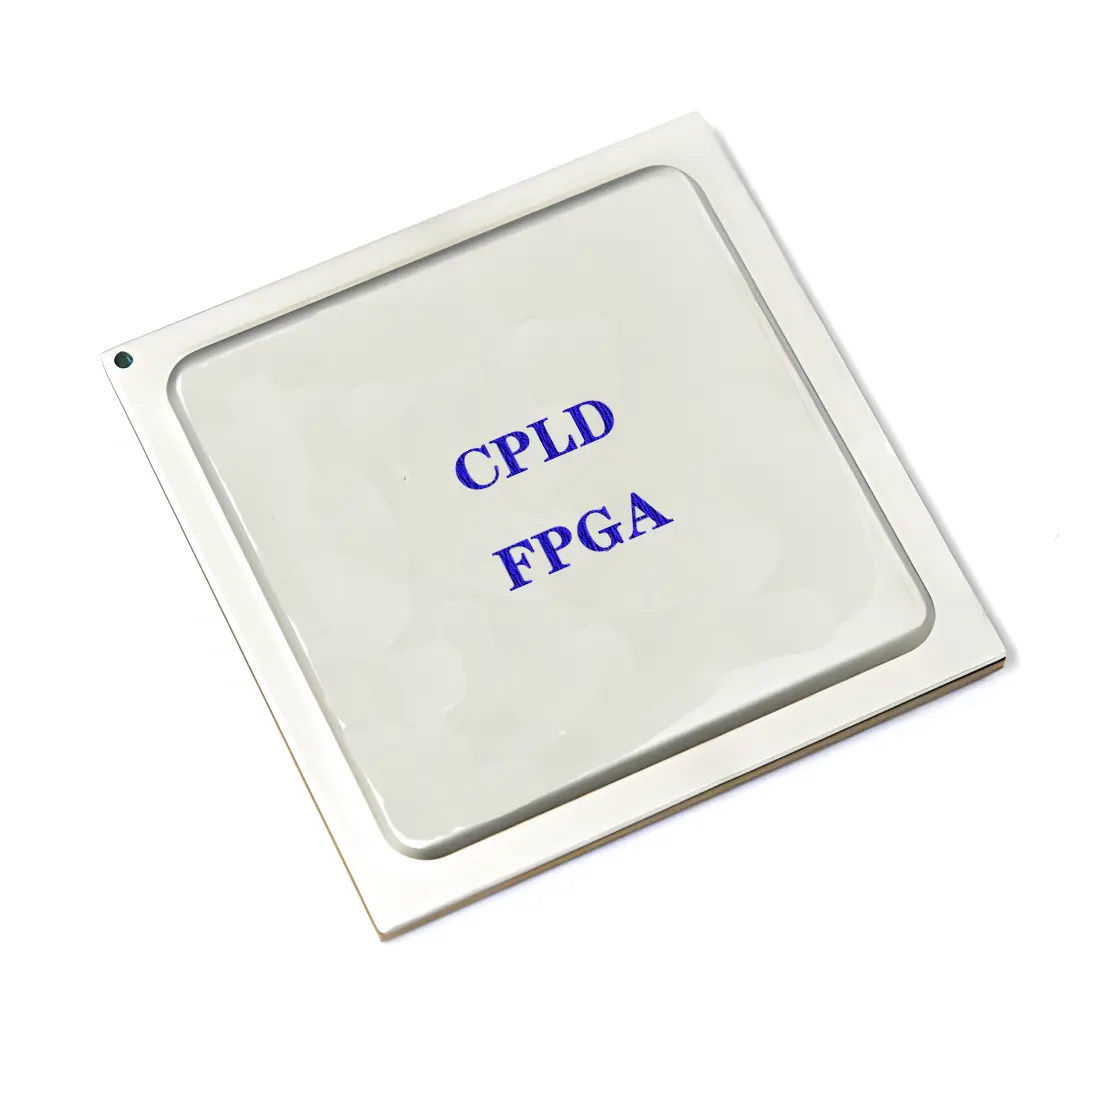 Programmable Logic Device(CPLD/FPGA)
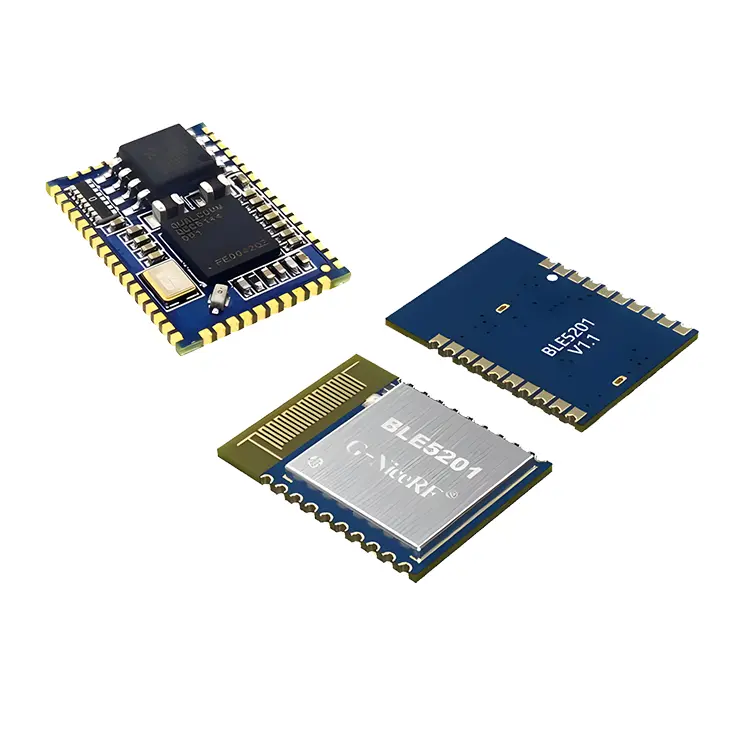 Communication Modules/IoT
 Resistors
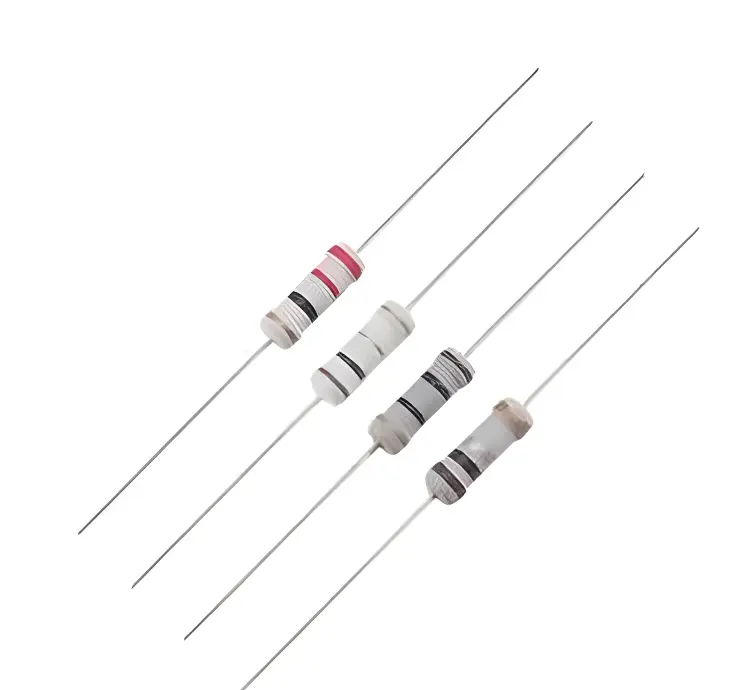 Through Hole Resistors
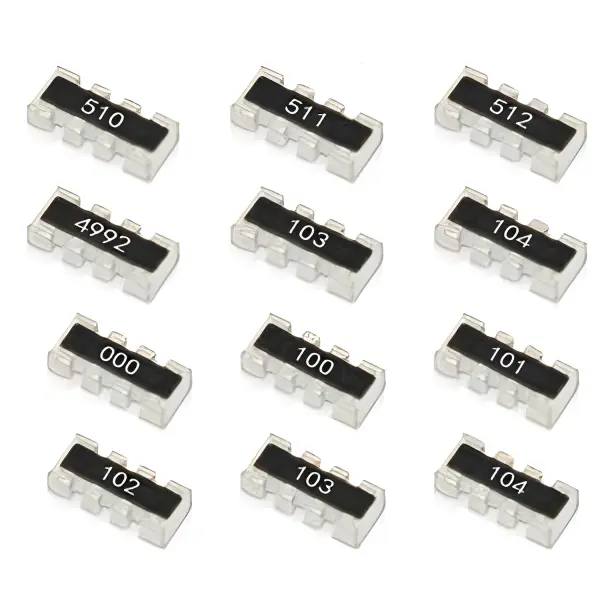 Resistor Networks, Arrays
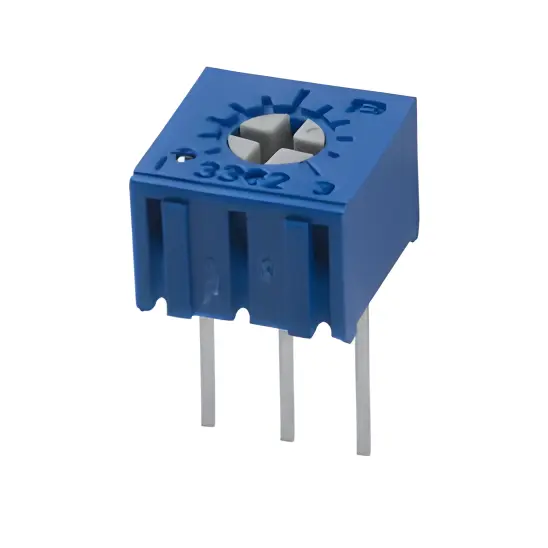 Potentiometers,Variable Resistors
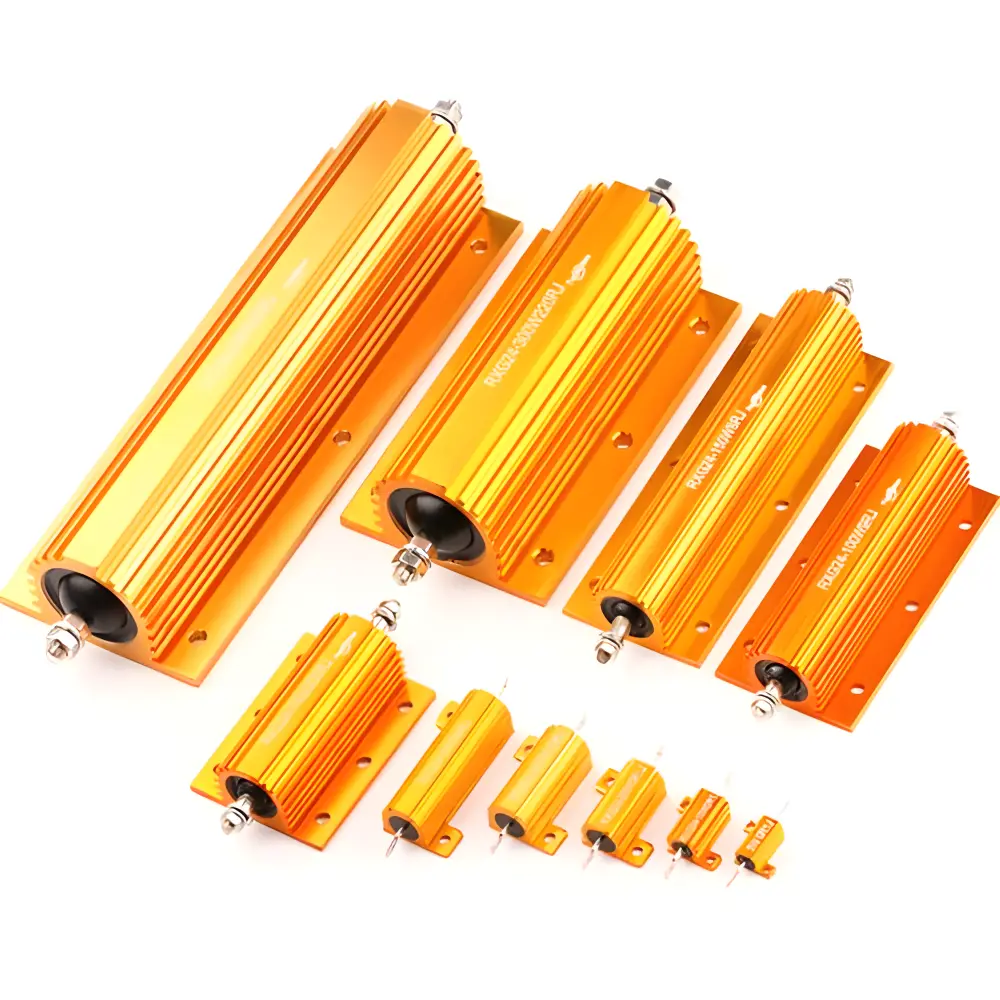 Aluminum Case,Porcelain Tube Resistance
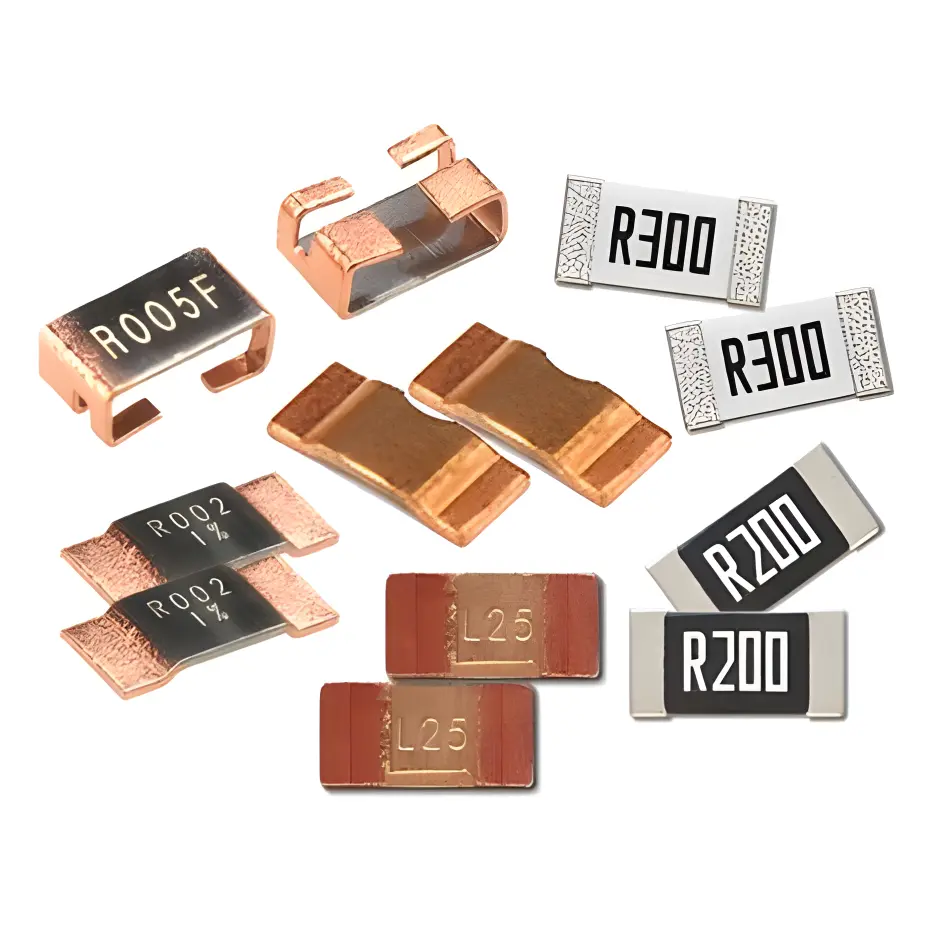 Current Sense Resistors,Shunt Resistors
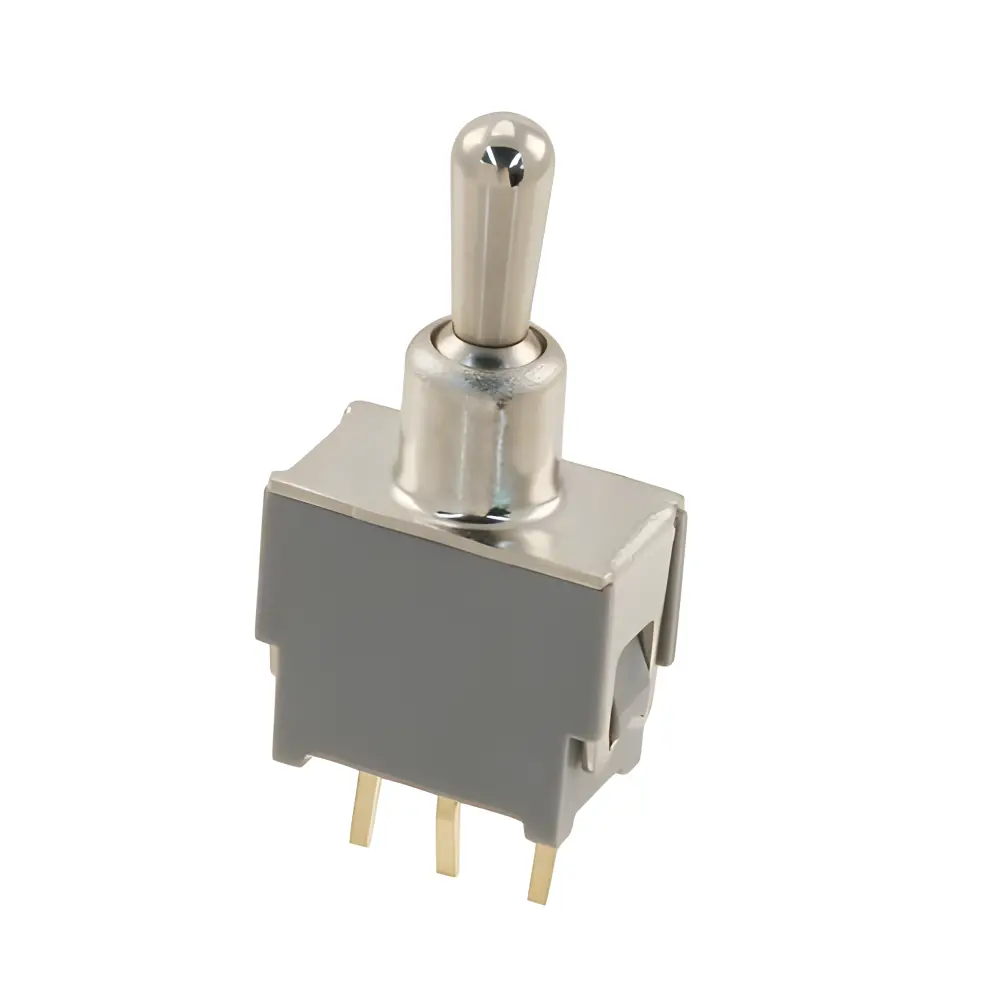 Switches
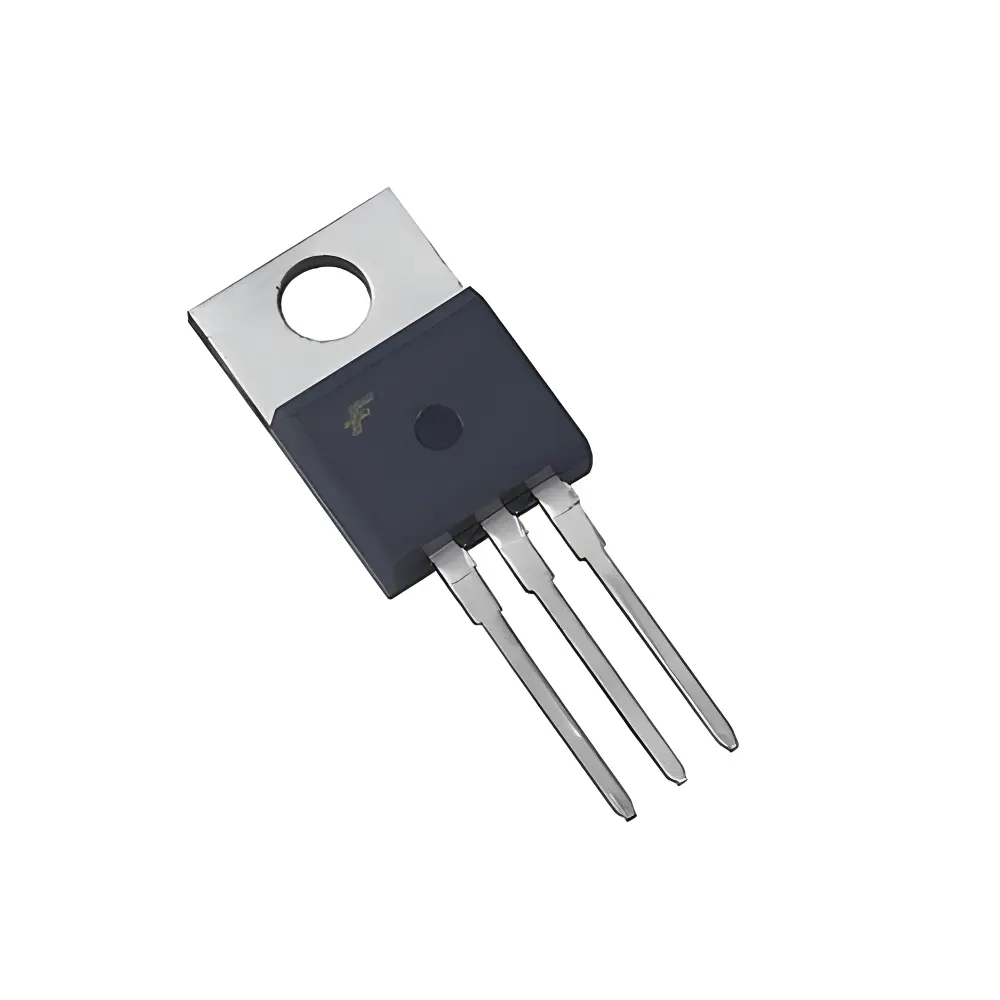 Transistors
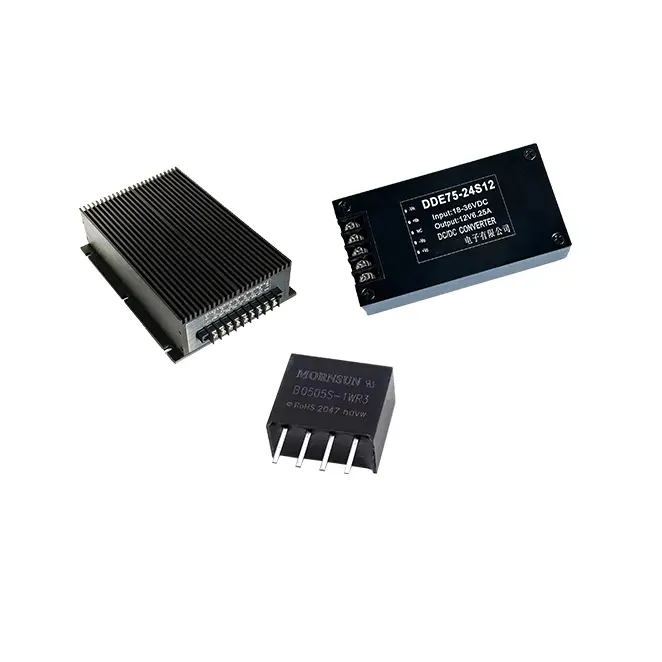 Power Modules
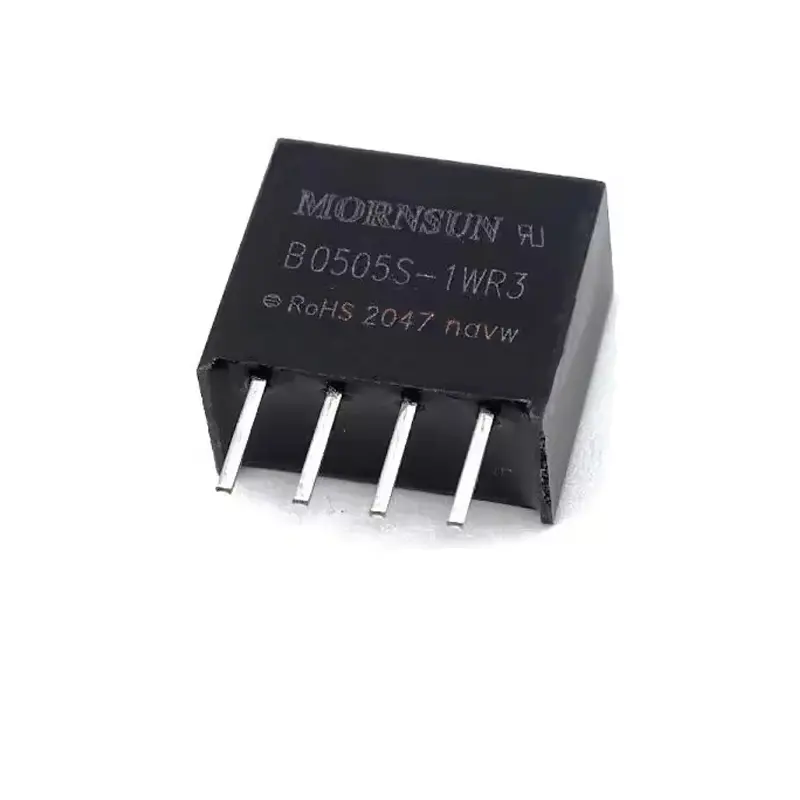 Isolated Power Modules
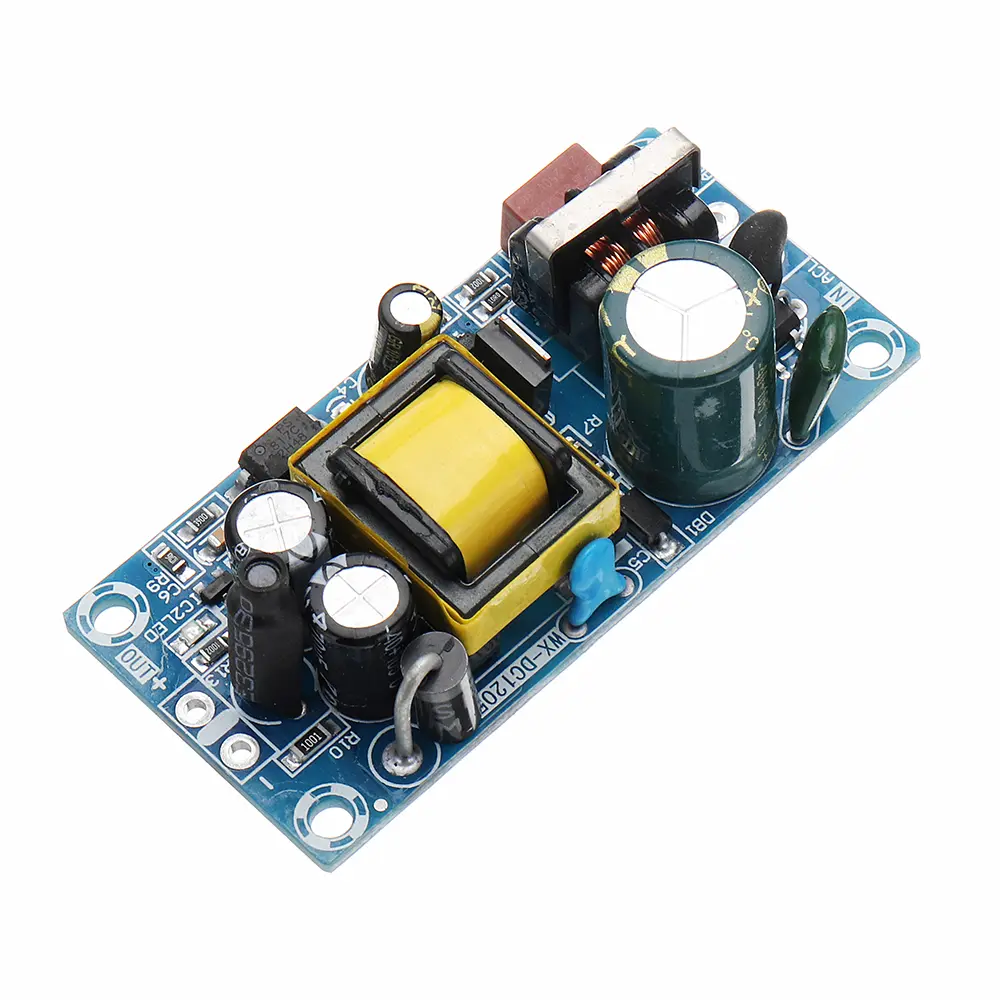 AC-DC Power Modules
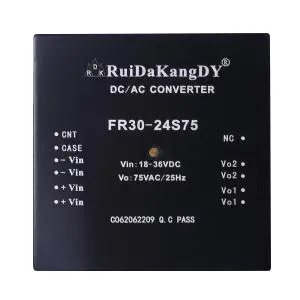 DC-AC Module(Inverter)
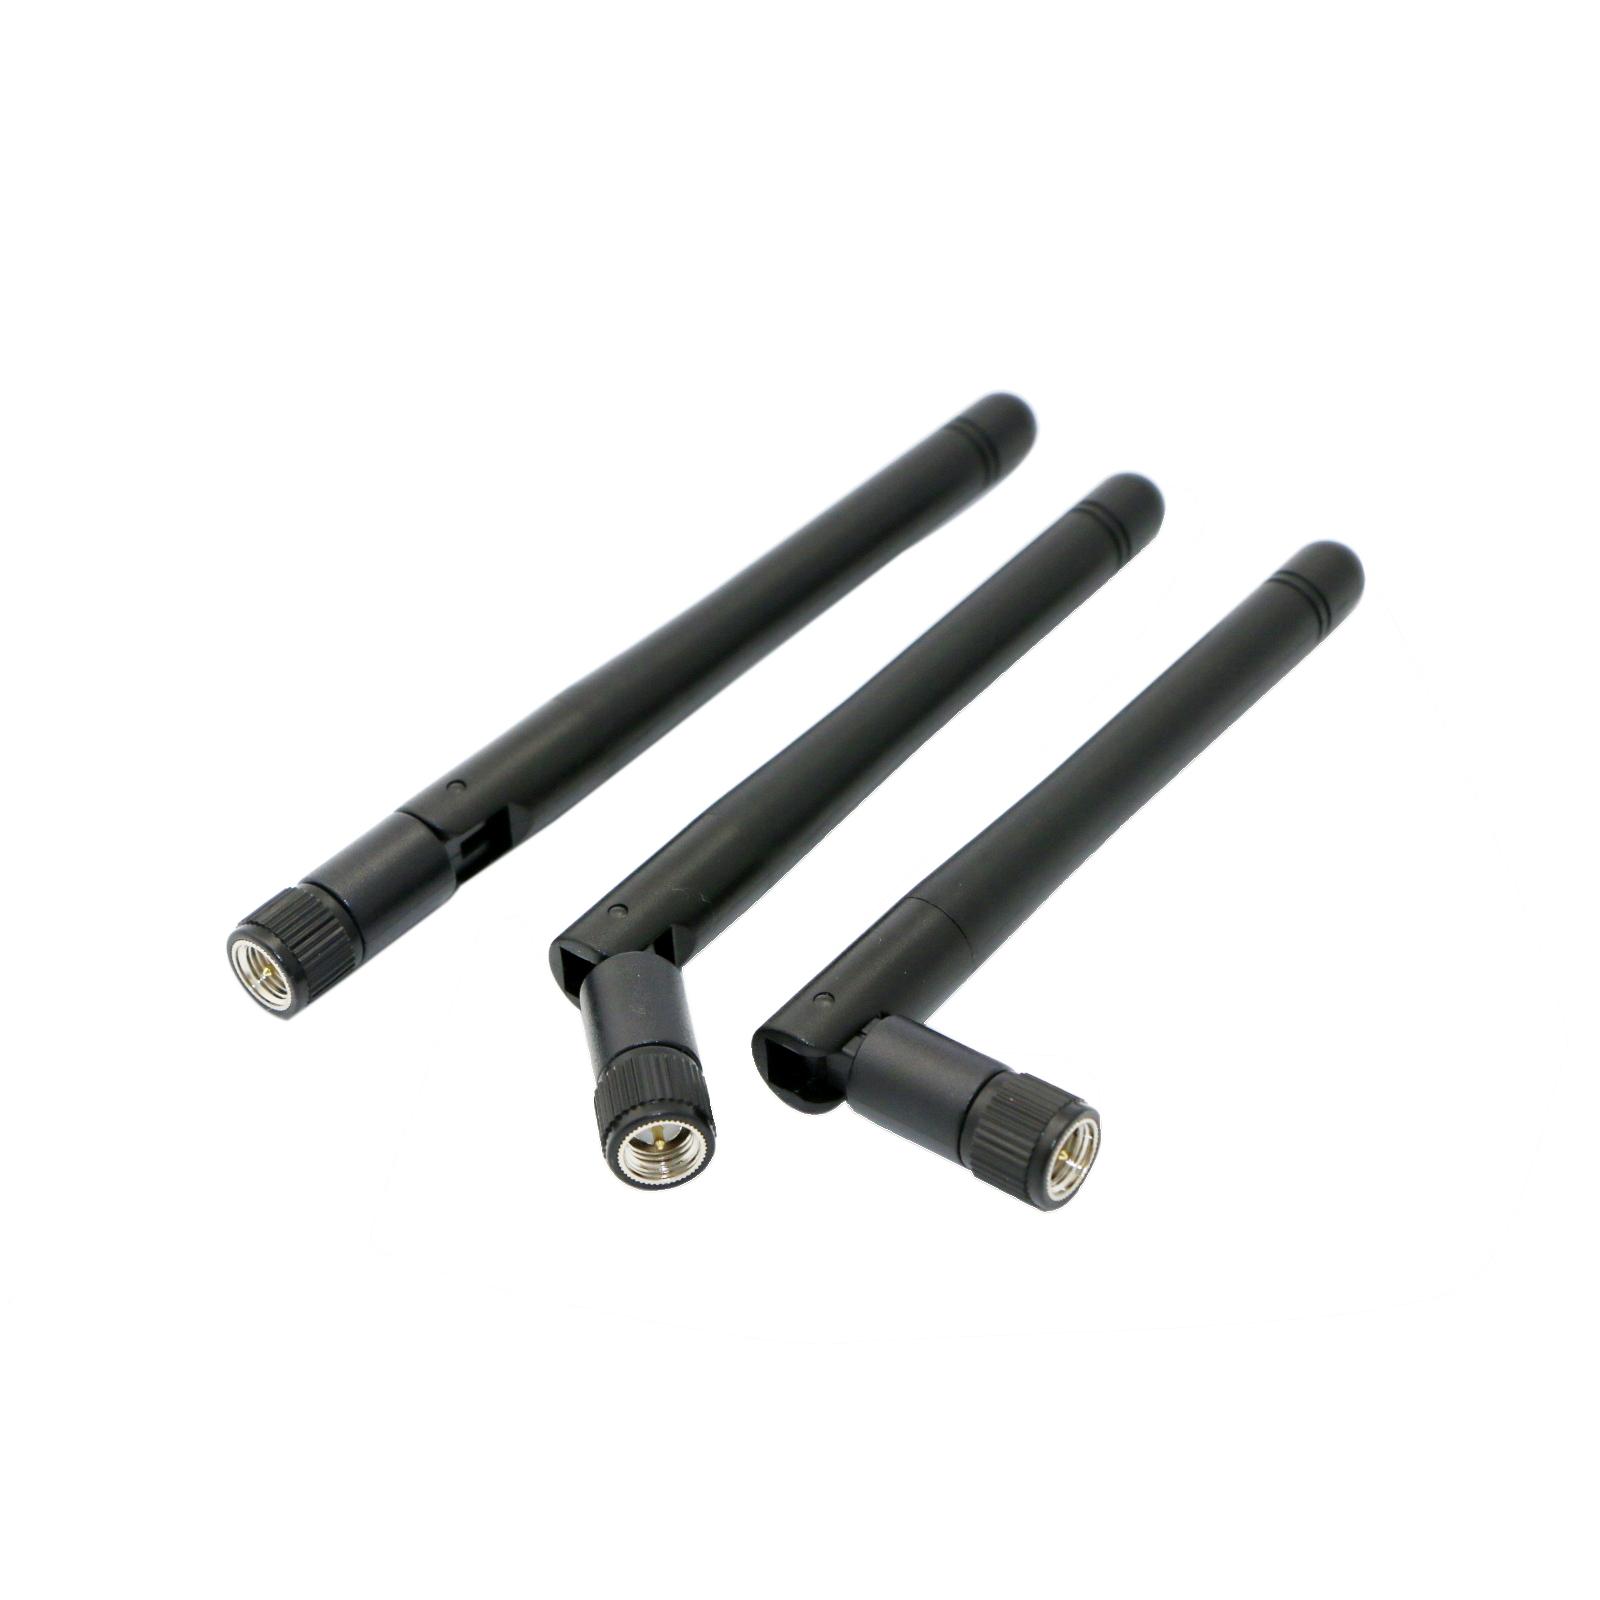 RF and Wireless
Achieving Ultra-Low Surface Roughness (Ra<0.3μm) on High-Frequency Circuits via Electrochemical Polishing
SuRFace roughness of high-frequency circuits (e.g., 5G mmWave antennas, SerDes traces) directly impacts signal loss and impedance consistency. At Ra>0.5μm, skin effect-induced loss exceeds 15% at 28GHz. Electrochemical polishing (ECP) enables atomic-level smoothing through controlled anodic dissolution, offering advantages over mechanical methods.
1. ECP Mechanisms and Parameter Modeling
1.1 Anodic Dissolution Kinetics
Copper dissolution under electric field:
Rate governed by Butler-Volmer equation:
Potential must be controlled in the passivation zone (Figure 1) for uniform removal.
1.2 Electrolyte Formulation
-
Base composition:
-
H₃PO₄: 65vol% (high viscosity suppresses pitting);
-
H₂SO₄: 15vol% (enhances conductivity);
-
Glycerol: 10vol% (surfactant reduces Ra);
-
DI water: 10vol%.
-
-
Additives:
-
BTA: 0.1g/L (inhibits grain boundary corrosion);
-
PEG-4000: 0.5g/L (forms adsorption layer for planarization).
-
2. Process Parameter Optimization
2.1 Polarization Curve Analysis (Figure 2)
Using potentiostat (e.g., Gamry 5000) to determine optimal potential:
-
Active region: 0.6-0.8V (vs. SCE) avoids over-etching;
-
Limiting current density: 2-3A/dm² (higher values cause pitting).
2.2 Dynamic Parameter Setup
-
Current density: 1.5A/dm² (balances speed and quality);
-
Temperature: 25±1℃ (5℃ increase rAISes Ra by 0.05μm);
-
Time: 120-180s (adjusted per initial Ra);
-
Electrode gap: 50mm (narrow gaps cause uneven fields).
3. Surface Morphology Control and Inspection
3.1 Smoothing Mechanisms
-
Macro-level: High viscosity suppresses protrusion dissolution;
-
Micro-level: Additive adsorption enables atomic step-flow (Figure 3).
3.2 Roughness Measurement
-
White-light interferometry: 0.1nm vertical resolution, 100×100μm² scan;
-
AFM: Contact mode, <10nm tip radius for 3D topography.
4. Case Studies and Performance
4.1 High-Frequency Hybrid PCB Data
| Parameter | Pre-ECP | Post-ECP |
|---|---|---|
| Ra (μm) | 0.72 | 0.25 |
| Rz (μm) | 3.8 | 1.2 |
| 28GHz Loss (dB/cm) | 0.45 | 0.29 |
4.2 Reliability Tests
-
Corrosion resistance: 48h salt spray (5% NaCl, 35℃) with no oxidation;
-
Adhesion: Tape peel test (IPC-TM-650 2.4.1) shows no delamination.
5. Defect Analysis and Solutions
5.1 Edge Over-Etching
-
Cause: Current crowding at edges;
-
Solutions:
-
Cathode shielding (5mm width);
-
Pulsed current (30% duty cycle, 100Hz).
-
5.2 Orange Peel Texture
-
Cause: Additive unevenness or temperature drift;
-
Solutions:
-
Electrolyte filtration (1μm precision);
-
PID temperature control (±0.5℃).
-